Answered step by step
Verified Expert Solution
Question
1 Approved Answer
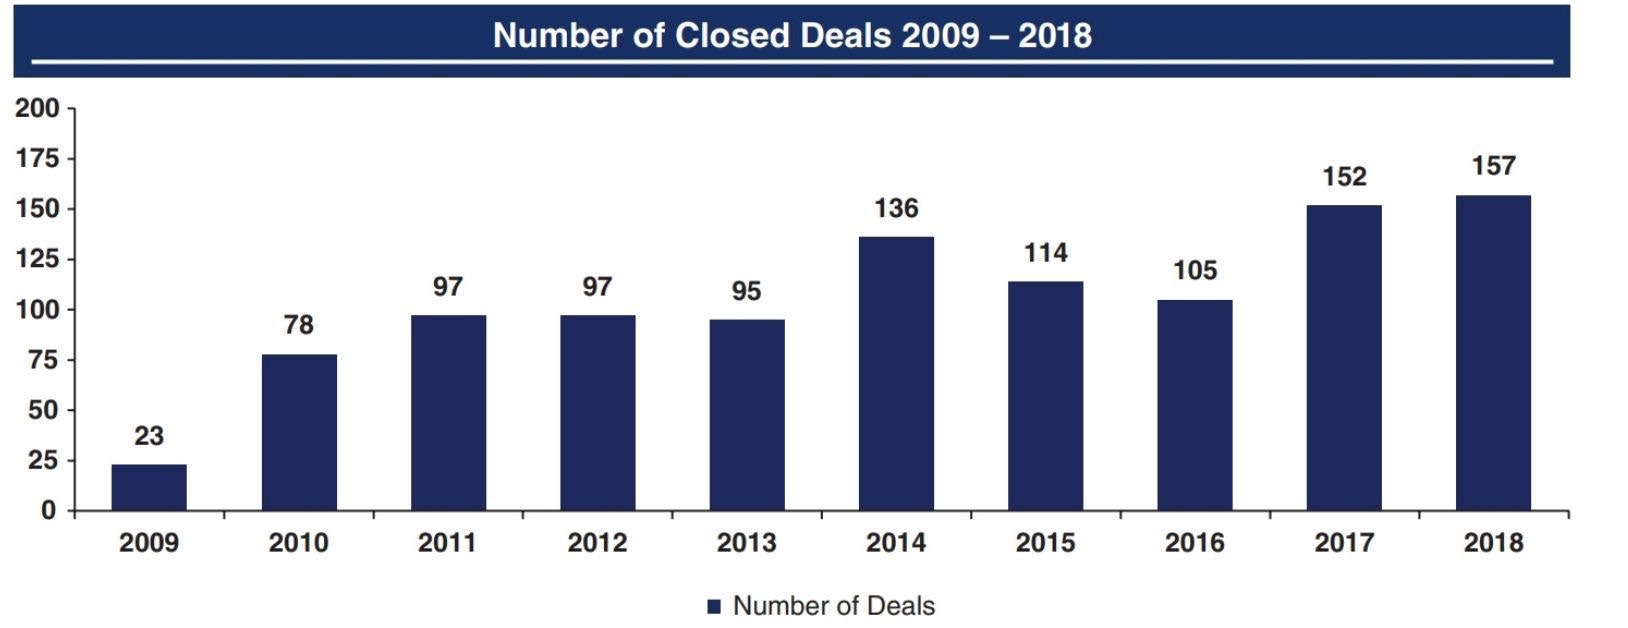
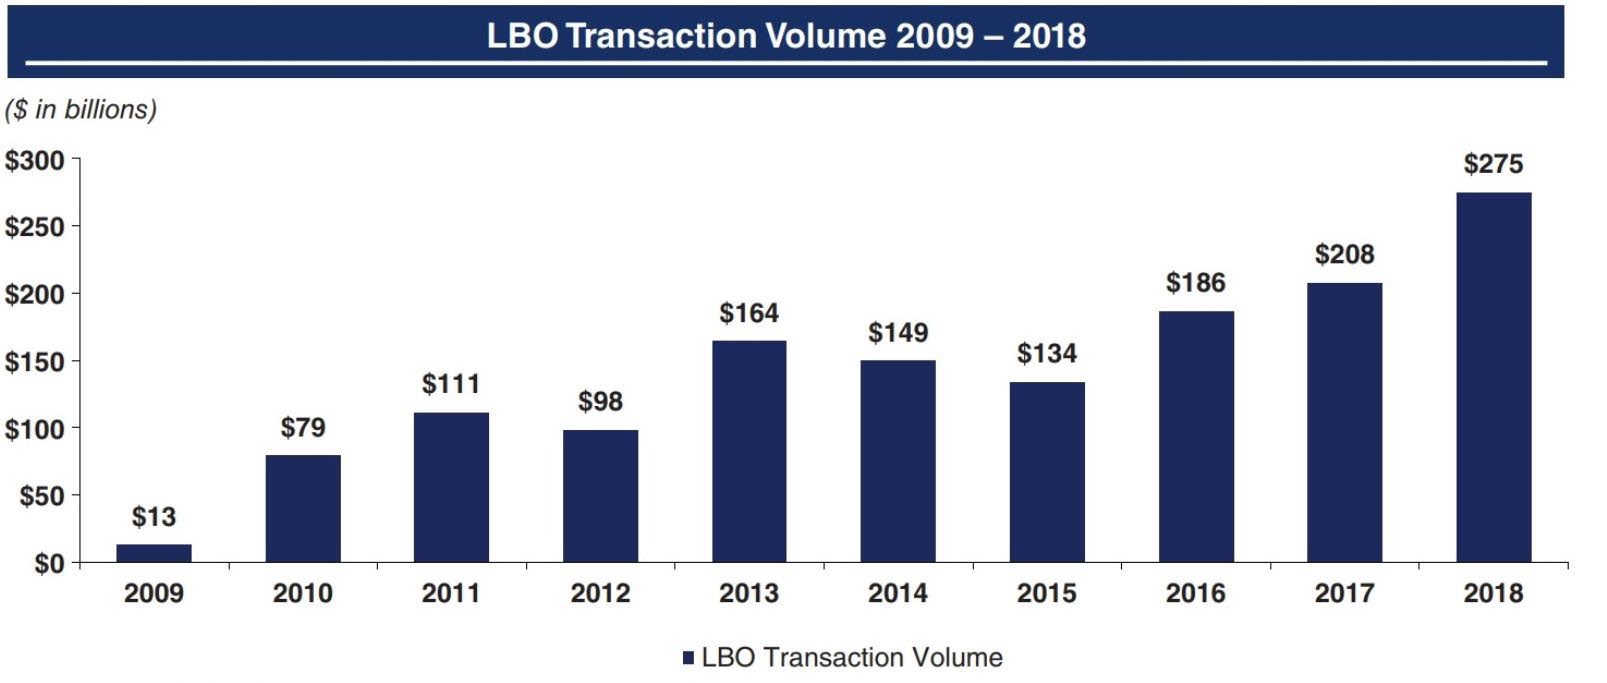
a) These figures provide the number and volume of deals for the Leverage Buyout (LBO) transactions that took place in the U.S. market. Critically explain


a) These figures provide the number and volume of deals for the Leverage Buyout (LBO) transactions that took place in the U.S. market. Critically explain the effect of the Global Financial Crisis (GFC) in the Leverage Buyout market. (20 marks)
iliiliili LBO Transaction Volume 20092018 (\$ in billions) - LBO Transaction VolumeStep by Step Solution
There are 3 Steps involved in it
Step: 1

Get Instant Access to Expert-Tailored Solutions
See step-by-step solutions with expert insights and AI powered tools for academic success
Step: 2

Step: 3

Ace Your Homework with AI
Get the answers you need in no time with our AI-driven, step-by-step assistance
Get Started


