

Answered step by step
Verified Expert Solution
Question
1 Approved Answer
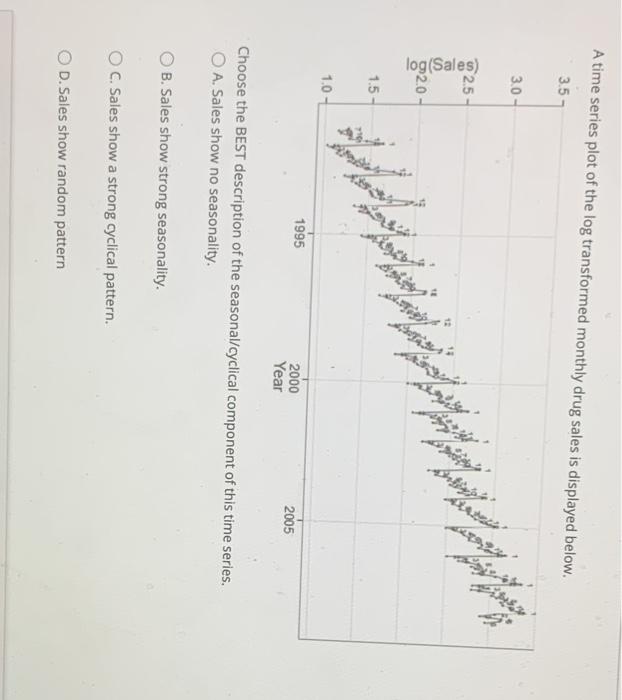
A time series plot of the log transformed monthly drug sales is displayed below. 3.5 3.0 2.5 92.0 - 1.5 1.0 1995 2000 Year 2005
Step by Step Solution
There are 3 Steps involved in it
Step: 1

Get Instant Access to Expert-Tailored Solutions
See step-by-step solutions with expert insights and AI powered tools for academic success
Step: 2

Step: 3
Ace Your Homework with AI
Get the answers you need in no time with our AI-driven, step-by-step assistance
Get Started
Finance Applications And Theory
Authors: Marcia Cornett, Troy Adair, John Nofsinger
1st Edition
0073382256, 9780073382258