A turnover-control analysis using these tables, describe what might be happening and solutions. Only for turnover control aspect. 37 38 Cash 2.04% 0.99% 0.49% 39
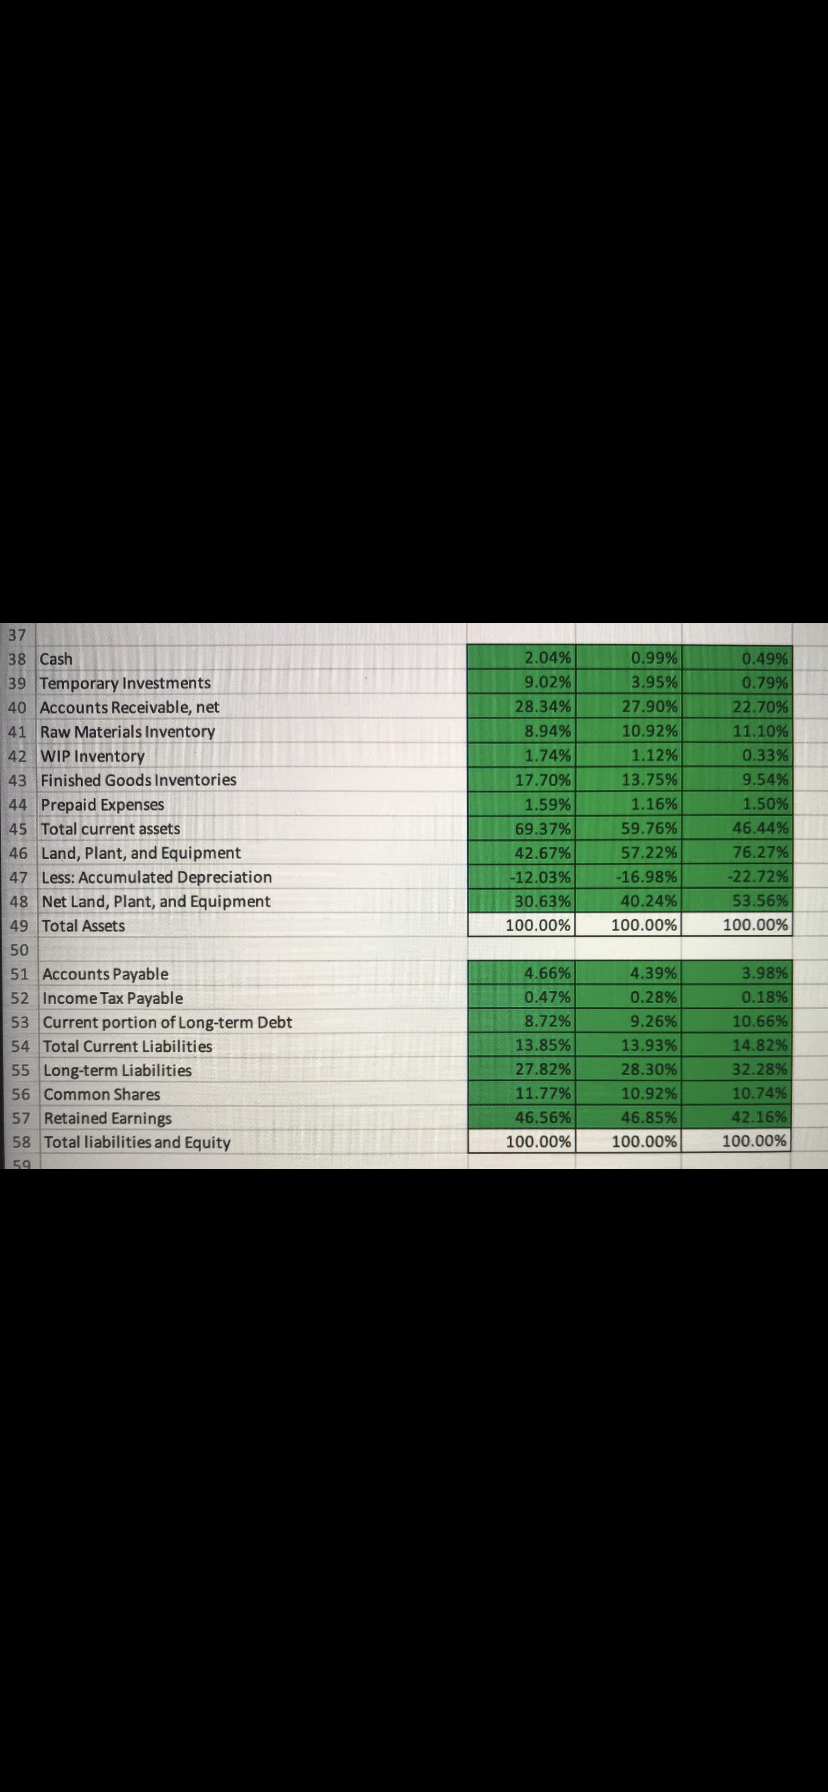
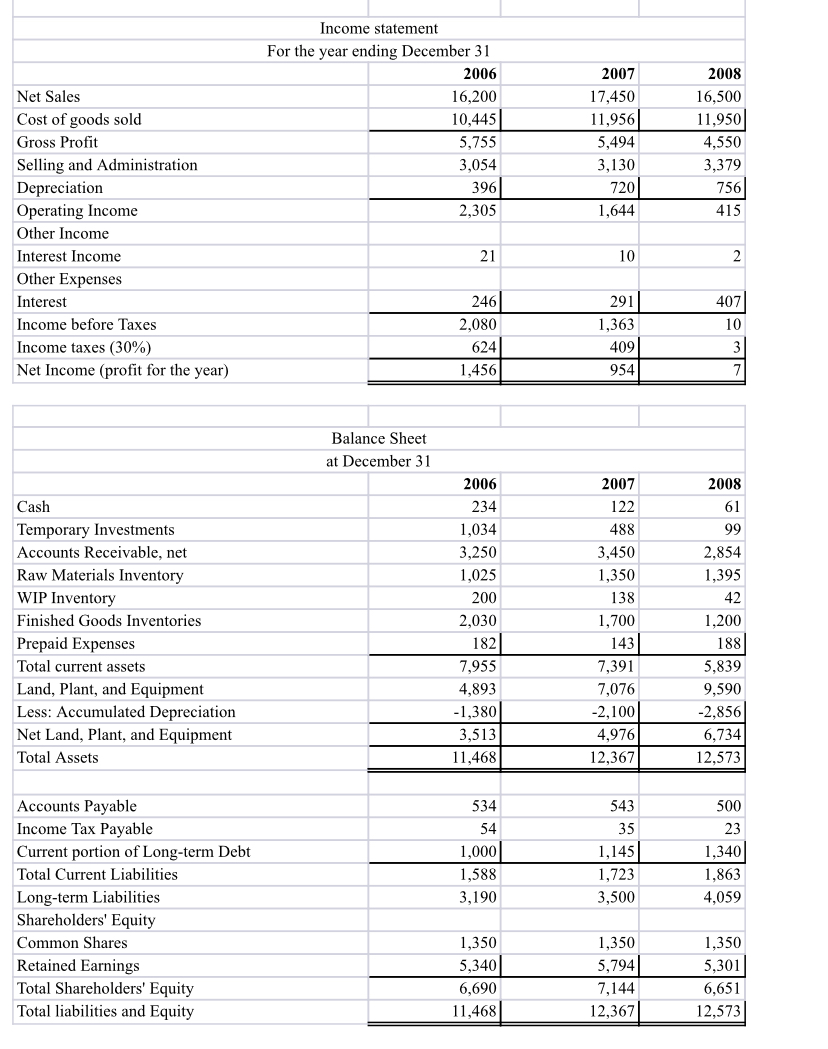
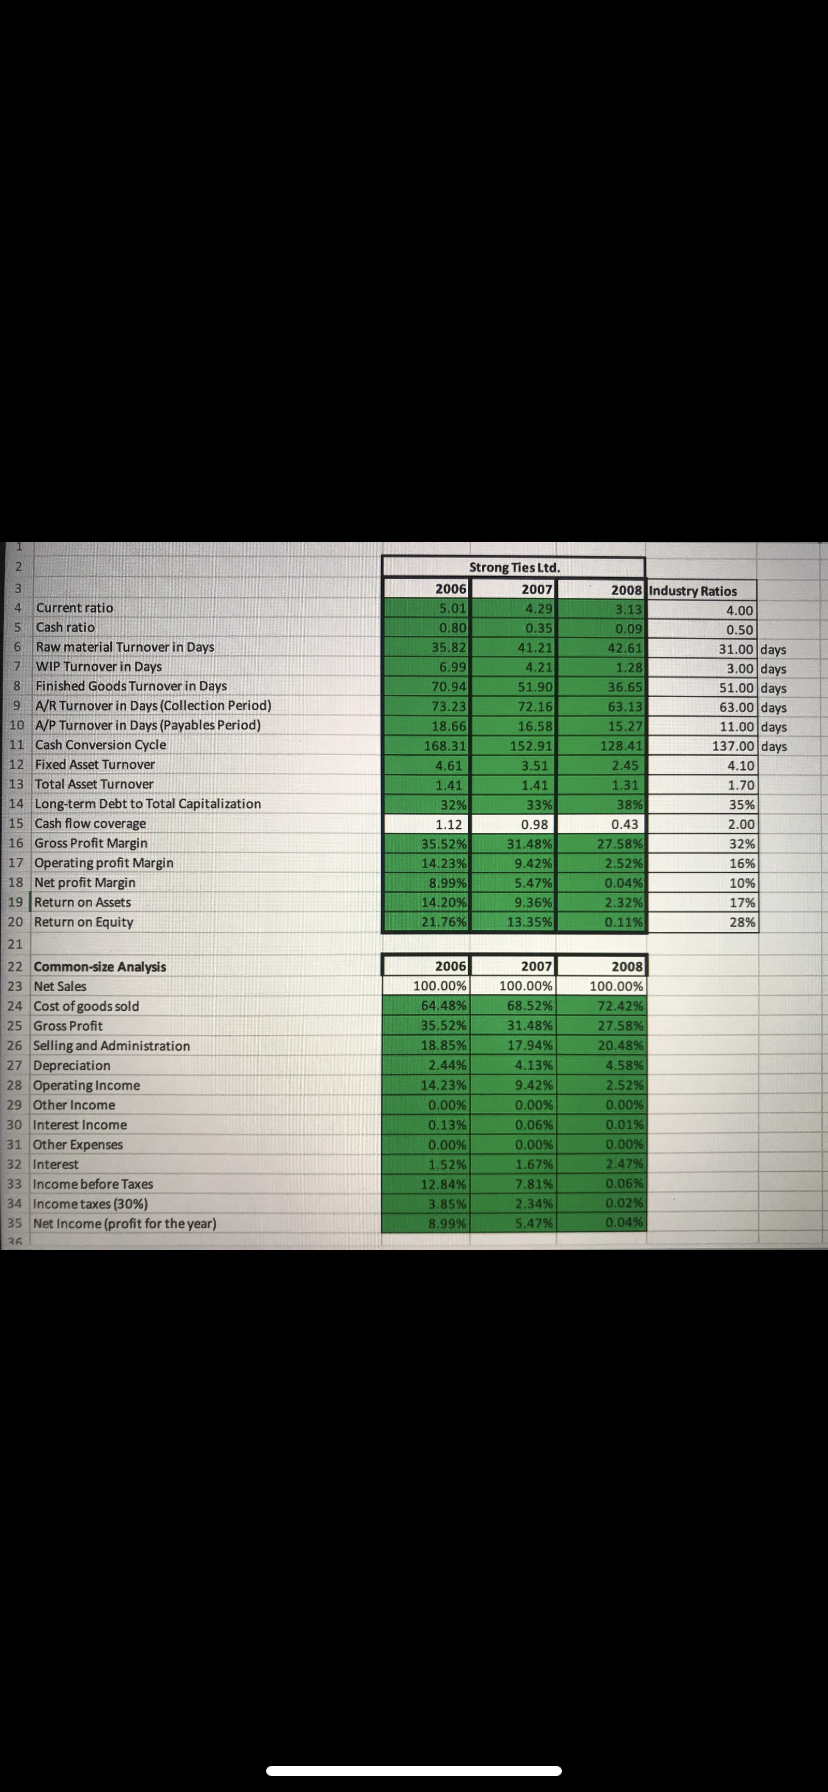
A turnover-control analysis using these tables, describe what might be happening and solutions. Only for turnover control aspect.
37 38 Cash 2.04% 0.99% 0.49% 39 Temporary Investments 9.02% 3.95% 0.79% Accounts Receivable, net 28.34% 27.90% 22.70% 41 Raw Materials Inventory 8.94% 10.92% 11.10% 42 WIP Inventory 1.74% 1.12% 0.33% 43 Finished Goods Inventories 17.70% 13.75% 9.54% 44 Prepaid Expenses 1.59% 1.16% 1.50% 45 Total current assets 69.37% 59.76% 46.44% 46 Land, Plant, and Equipment 42.67% 57.22% 76.27% 47 Less: Accumulated Depreciation 12.03% 16.98% -22.72% 48 Net Land, Plant, and Equipment 30.63% 40.24% 53.56% 49 Total Assets 100.00% 100.00% 100.00% 50 51 Accounts Payable 4.66% 4.39% 3.98% 52 Income Tax Payable 0.47% 0.28% 0.18% 53 Current portion of Long-term Debt 8.72% 9.26% 10.66% 54 Total Current Liabilities 13.85% 13.93% 14.82% 55 Long-term Liabilities 27.82% 28.30% 32.28% 56 Common Shares 11.77% 10.92% 10.74% 57 Retained Earnings 46.56% 46.85% 42.16% 58 Total liabilities and Equity 100.00% 100.00% 100.00% 159Income statement For the year ending December 31 2006 2007 2008 Net Sales 16,200 17,450 16,500 Cost of goods sold 10,445 11,956 11,950 Gross Profit 5,755 5,494 4,550 Selling and Administration 3,054 3,130 3,379 Depreciation 396 720 756 Operating Income 2,305 1,644 415 Other Income Interest Income 21 10 2 Other Expenses Interest 246 291 407 Income before Taxes 2,080 1,363 10 Income taxes (30%) 24 409 3 Net Income (profit for the year) 1,456 954 Balance Sheet at December 31 2006 2007 2008 Cash 234 122 61 Temporary Investments 1,034 488 99 Accounts Receivable, net 3,250 3,450 2,854 Raw Materials Inventory 1,025 1,350 1,395 WIP Inventory 200 138 42 Finished Goods Inventories 2,030 1,700 1.200 Prepaid Expenses 182 143 188 Total current assets 7,955 7,391 5,839 Land, Plant, and Equipment 4,893 7,076 9,590 Less: Accumulated Depreciation -1,380 -2,100 -2,856 Net Land, Plant, and Equipment 3,513 4,976 6,734 Total Assets 11,468 2,367 12,573 Accounts Payable 534 543 500 Income Tax Payable 54 35 23 Current portion of Long-term Debt 1,000 1,145 1,340 Total Current Liabilities 1,588 1,723 1,863 Long-term Liabilities 3,190 3,500 4,059 Shareholders' Equity Common Shares 1,350 1,350 1,350 Retained Earnings 5,340 5,794 5,301 Total Shareholders' Equity 6,690 7,144 6,651 Total liabilities and Equity 11,468 12,367 12,573Strong Ties Ltd. W N 2006 2007 2008 Industry Ratios Current ratio 5.01 1.29 3.13 4.00 Cash ratio 0.80 0.35 0.09 0.50 Raw material Turnover in Days 35.82 41.21 42.61 31.00 days WIP Turnover in Days 6.99 4.21 1.28 3.00 days Finished Goods Turnover in Days 70.94 51.90 36.65 51.00 days A/R Turnover in Days (Collection Period) 73.23 72.16 63.13 63.00 days 10 A/P Turnover in Days (Payables Period) 18.66 16.58 15.27 11.00 days 11 Cash Conversion Cycle 168.31 152.91 128.41 137.00 days 12 Fixed Asset Turnover 4.61 3.51 2.45 4.10 13 Total Asset Turnover 1.41 1.41 1.31 1.70 14 Long-term Debt to Total Capitalization 32% 33% 38% 35% 15 Cash flow coverage 1.12 0.98 0.43 2.00 16 Gross Profit Margin 35.52% 31.48% 27.58% 32% 17 Operating profit Margin 14.23% 9.42% 2.52% 16% 18 Net profit Margin 8.99% 5.47% 0.04% 10% 19 Return on Assets 14.20% 9.36% 2.32% 17% 20 Return on Equity 21.76% 13.35% 0.11% 28% 21 22 Common-size Analysis 2006 2007 2008 23 Net Sales 100.00% 100.00% 100.00% 24 Cost of goods sold 64.48% 68.52% 72.429% 25 Gross Profit 35.52% 31.48% 27.58% 26 Selling and Administration 18.85% 17.94% 20.48% 27 Depreciation 2.44% 4.13% 4.58% 28 Operating Income 14.23% 9.42% 2.52% 29 Other Income 0.00% 0.00% 0.00% 30 Interest Income 0.13% 0.06% 0.01% 31 Other Expenses 0.00% 0.00% 0.00% 32 Interest 1.52% 1.67% 2.47% 33 Income before Taxes 12.84% 7.81% 0.06% 34 Income taxes (30%) 3.85% 2.34% 0.02% 35 Net Income (profit for the year) 8.99% 5.47% 0.049 26
Step by Step Solution
There are 3 Steps involved in it
Step: 1
Get Instant Access to Expert-Tailored Solutions
See step-by-step solutions with expert insights and AI powered tools for academic success
Step: 2
Step: 3
Ace Your Homework with AI
Get the answers you need in no time with our AI-driven, step-by-step assistance