Question
A university lecturer at a large private university took a random sample of 55 students from her first-year Business Data Analysis course.She wishes to investigate
A university lecturer at a large private university took a random sample of 55 students from her first-year Business Data Analysis course.She wishes to investigate the relation between the number of hours students spend on casual employment per week and marks attained in the most recent assessment item.For each student, the number of hours worked per week and marks attained were recorded.The data are stored in 'HoursMark55' worksheet in the xls. data file attached.
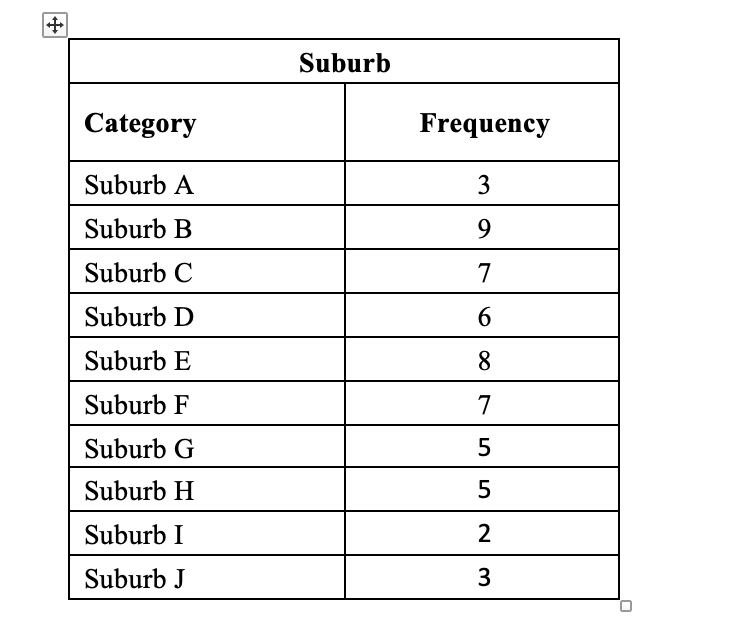
In addition, students were also asked to respond to survey questions concerning other variables (e.g. major of study chosen, suburb where student lives, country of origin, etc).The lecturer categorised the data collected on the variable suburb where student lives into ten suburbs, and calculated the frequencies as presented in the table below.

Step by Step Solution
There are 3 Steps involved in it
Step: 1

Get Instant Access to Expert-Tailored Solutions
See step-by-step solutions with expert insights and AI powered tools for academic success
Step: 2

Step: 3

Ace Your Homework with AI
Get the answers you need in no time with our AI-driven, step-by-step assistance
Get Started


