

Question
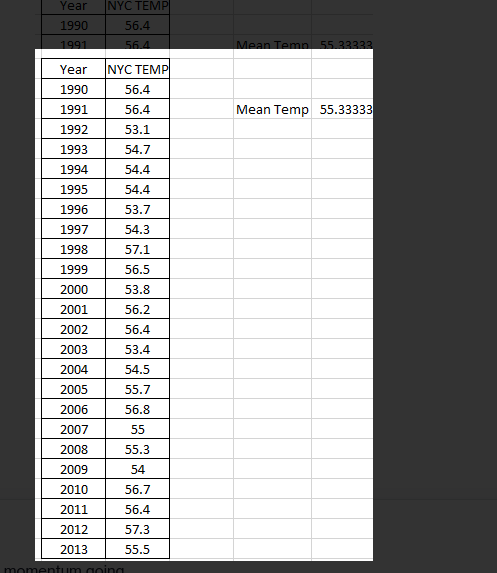
( a ) Use a statistical package to find the value of the linear correlation coefficient between year and NYC temp. (b) Is the correlation

( a ) Use a statistical package to find the value of the linear correlation coefficient between "year" and NYC temp.
(b) Is the correlation significant? Explain the reason for your answer
(c) If the correlation is significant, what does it imply about the trend in temperatures?
(d) Find the equation for the least squares regression (LSR) line
(e) Interpret the meaning of the slope of the LSR line.
(f) Based on the equation of LSR line, what is the "best predicted" value for the NYC Annual Average Temperature for 2013? How accurate is the prediction?
(g) Can we use this LSR line equation to predict the Annual Average Temperatures for the future? Explain.
Step by Step Solution
There are 3 Steps involved in it
Step: 1

Get Instant Access to Expert-Tailored Solutions
See step-by-step solutions with expert insights and AI powered tools for academic success
Step: 2

Step: 3
Ace Your Homework with AI
Get the answers you need in no time with our AI-driven, step-by-step assistance
Get Started
The Art And Craft Of Problem Solving
Authors: Paul Zeitz
3rd Edition
1119094844, 9781119094845