

Answered step by step
Verified Expert Solution
Question
1 Approved Answer
a. Use Excel's Data Analysis Exponential Smoothing tool to forecast each of the stock prices using simple exponential smoothing with a smoothing constant of 0
a. Use Excel's Data Analysis Exponential Smoothing tool to forecast each of the stock prices using simple exponential smoothing with a smoothing constant of 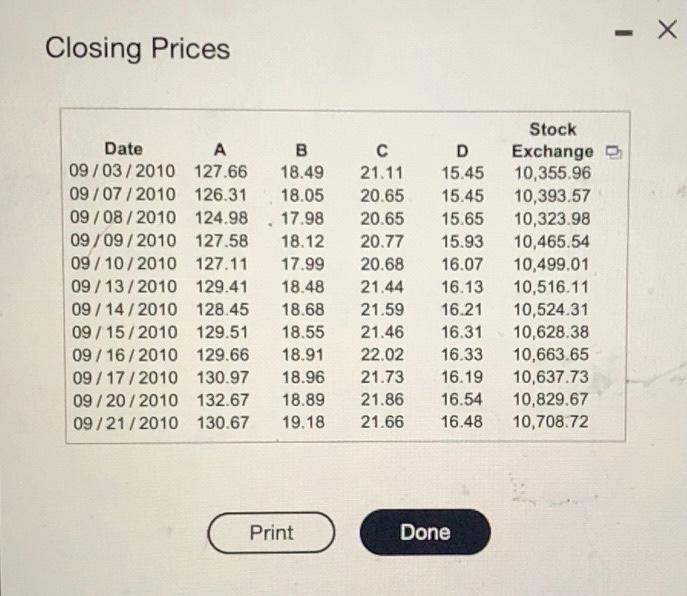
0.3.
Complete the exponential smoothing forecast model for stock A, B, C, D, & Stock exchange
(Type integers or decimals rounded to two decimal places as needed.)
Step by Step Solution
There are 3 Steps involved in it
Step: 1

Get Instant Access to Expert-Tailored Solutions
See step-by-step solutions with expert insights and AI powered tools for academic success
Step: 2

Step: 3
Ace Your Homework with AI
Get the answers you need in no time with our AI-driven, step-by-step assistance
Get Started
Analysis For Financial Management
Authors: Robert Higgins, Jennifer Koski, Todd Mitton
13th Edition
1260772365, 978-1260772364