

Question
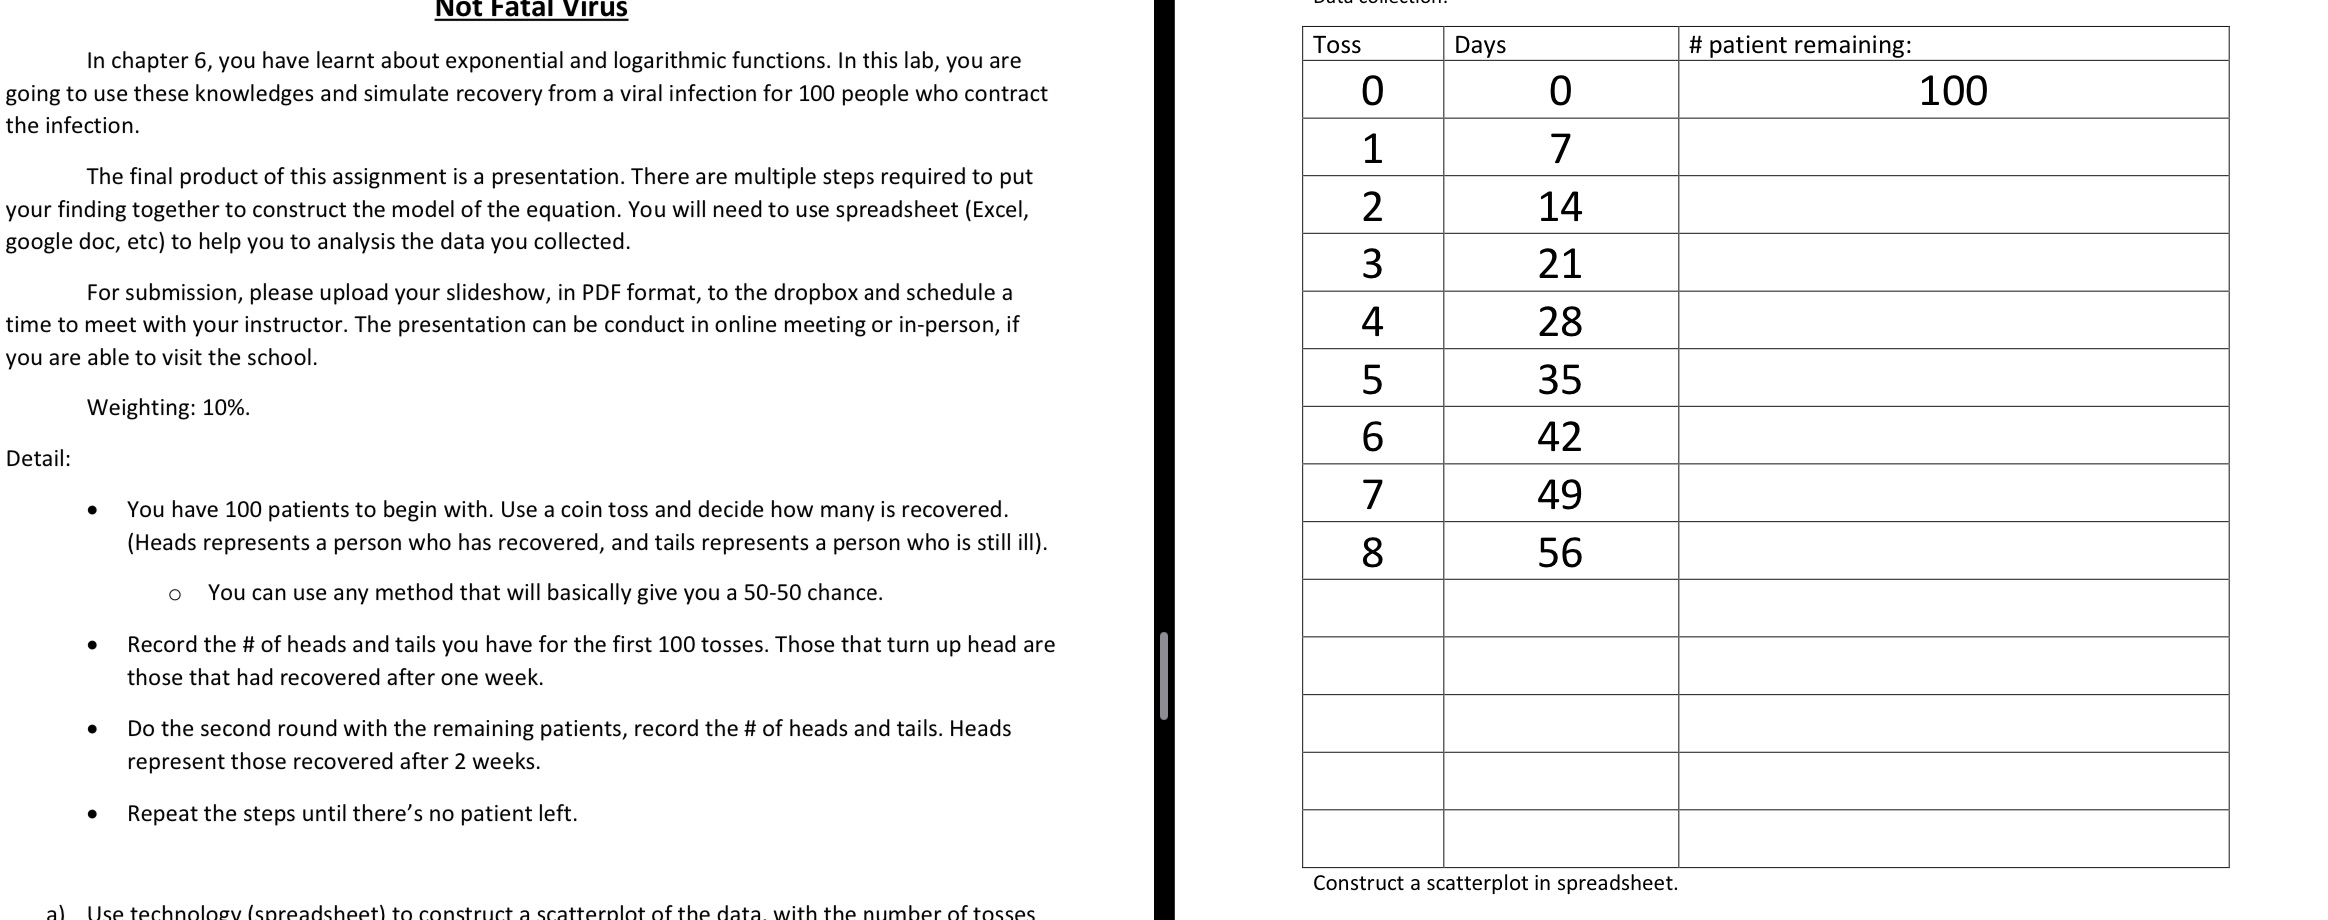
a) Use technology (spreadsheet) to construct a scatterplot of the data, with the number of tosses (days) as the independent variable and the number of
a) Use technology (spreadsheet) to construct a scatterplot of the data, with the number of tosses (days) as the independent variable and the number of peoples still ill as the dependent variable. b) Determine an equation for the curve of best fit for your data. Explain how you determined the best model. c) Predict how long it would take for 1600 people to get well. d) Justify your prediction (part c) algebraically. e) Does logarithmic model work well for this situation? Why or why not? The following worksheet is designed to help with collecting your data and analysis the result. Youmay not use the worksheet. However, you must not copy and paste this worksheet on to your presentation.Questions:What's the equation that best represent the model. How do you find it? How long will it take for 1600 peoples to get well and go home using your model. Justify your prediction algebraically. Does logarithmic model work well for this situation? Why or why not?
Step by Step Solution
There are 3 Steps involved in it
Step: 1

Get Instant Access to Expert-Tailored Solutions
See step-by-step solutions with expert insights and AI powered tools for academic success
Step: 2

Step: 3
Ace Your Homework with AI
Get the answers you need in no time with our AI-driven, step-by-step assistance
Get Started
Linear Algebra A Modern Introduction
Authors: David Poole
4th edition
1285463242, 978-1285982830, 1285982835, 978-1285463247