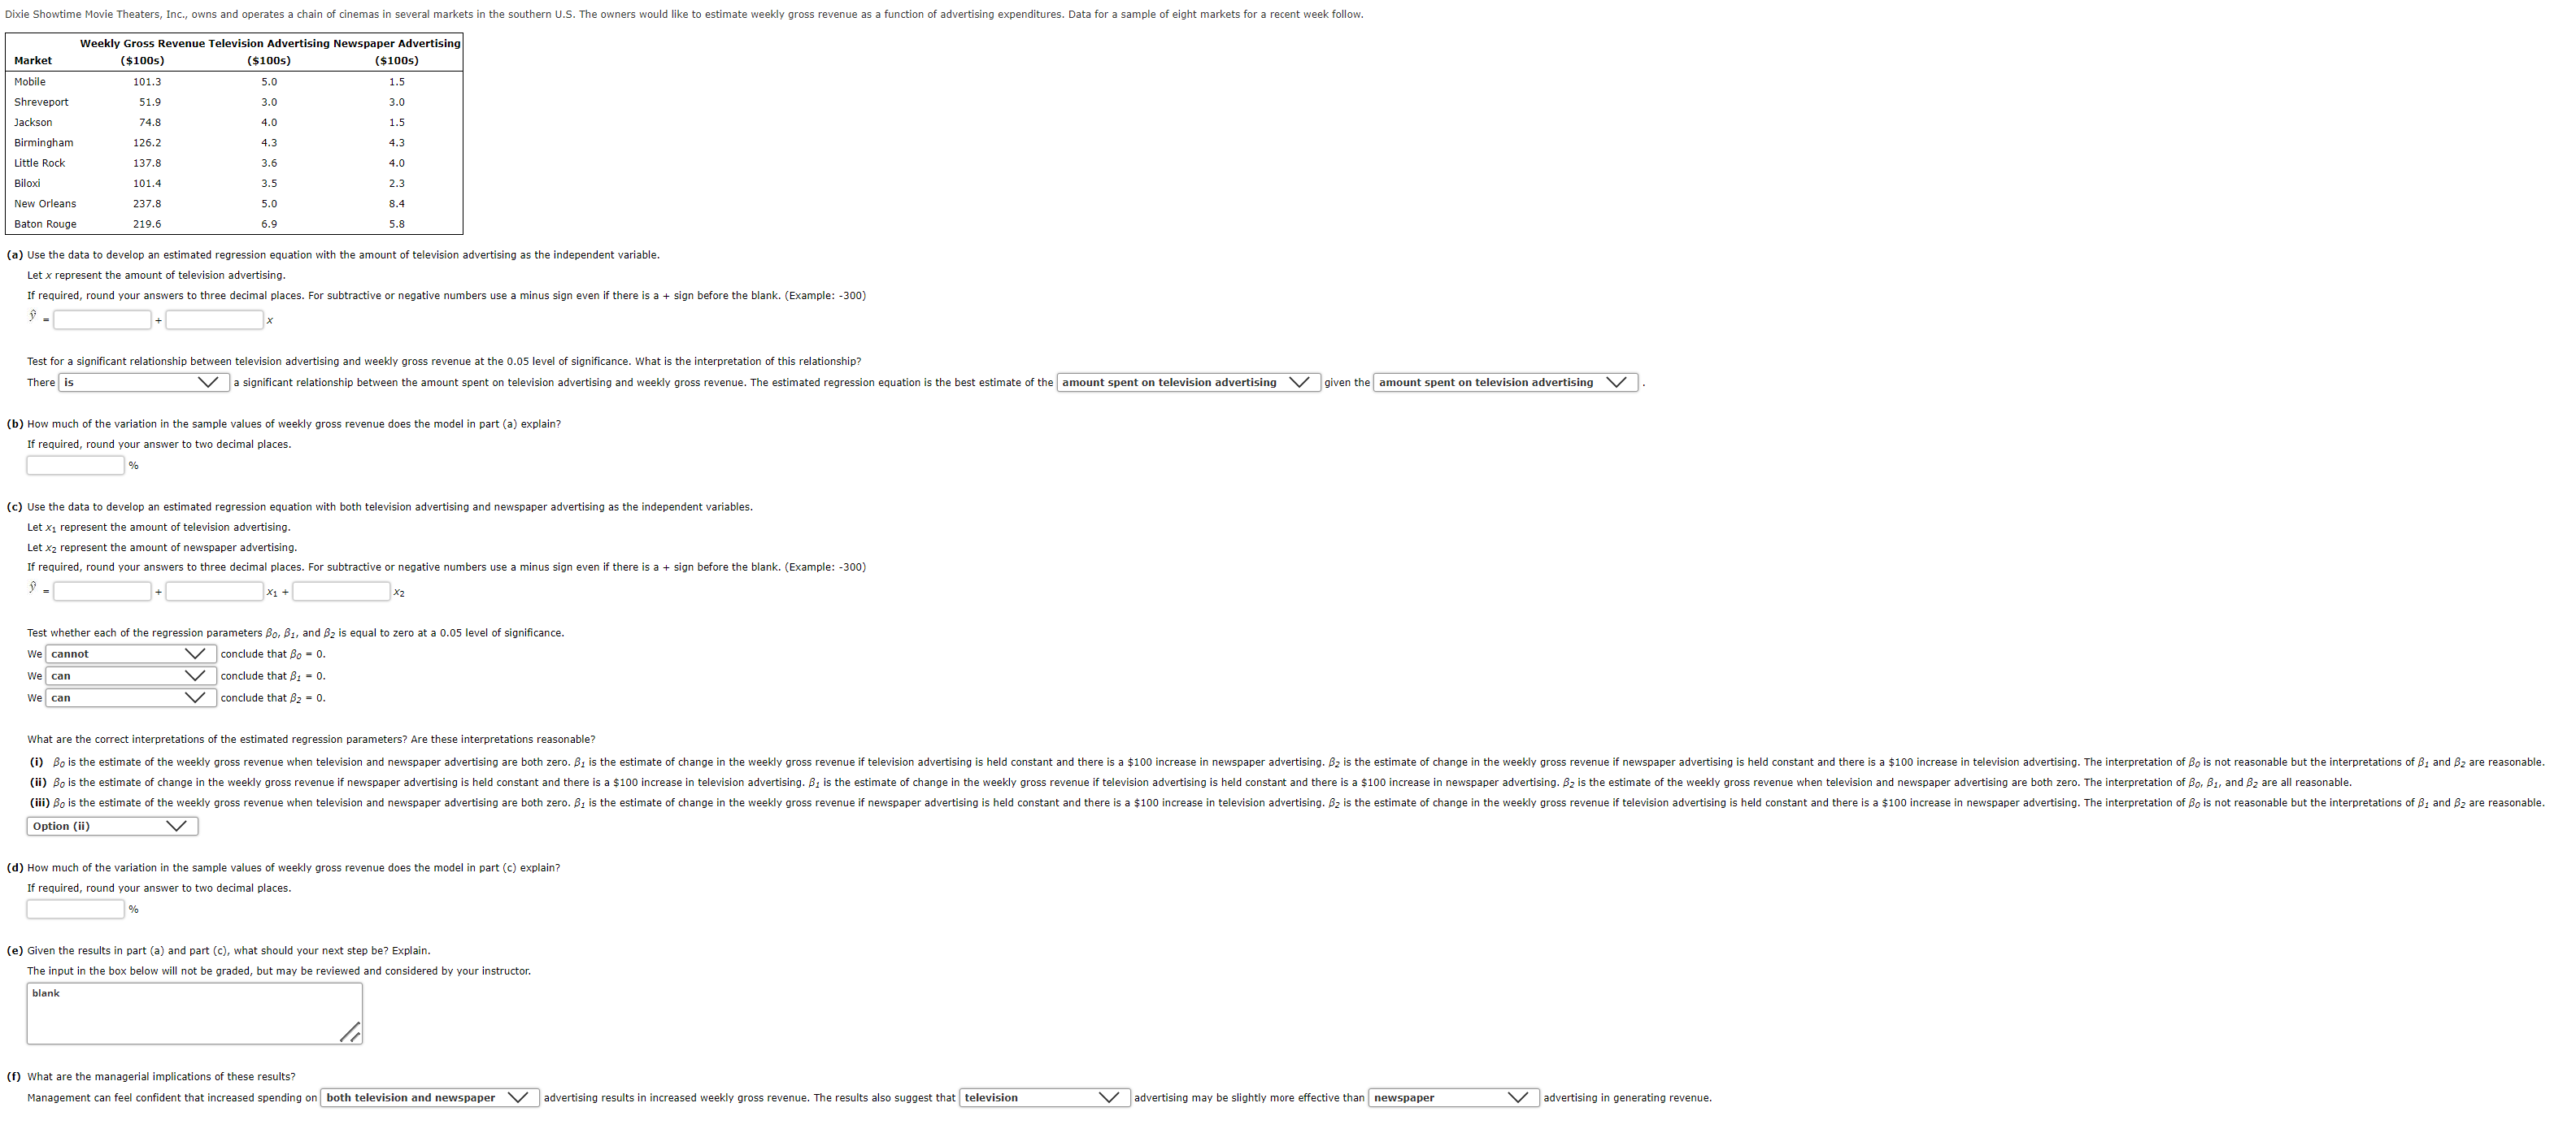
(a) Use the data to develop an estimated regression equation with the amount of television advertising as the independent variable. Let x represent the amount of television advertising. If required, round your answers to three decimal places. For subtractive or negative numbers use a minus sign even if there is a + sign before the blank. (Example: 300) y^= iven the (b) How much of the variation in the sample values of weekly gross revenue does the model in part (a) explain ir answer to two decimal places. (c) Use the data to develop an estimated regression equation with both television advertising and newspaper advertising as the independent variables. Let x1 represent the amount of television advertising. Let x2 represent the amount of newspaper advertising. If reauired. round vour answers to three decimal places. y^= (d) How much of the variation in the sample values of weekly gross revenue does the model in part (c) explain? Ir answer to two decimal places. (e) Given the results in part (a) and part (c), what should your next step be? Explain. The input in the box below will not be graded, but may be reviewed and considered by your instructor. (f) What are the managerial implications of these results? Management can feel confident that increased spending on both television and newspaper V advertising results in increased weekly gross revenue. The results also suggest that Jadvertising may be slightly more effective thar |advertising in generating revenue. (a) Use the data to develop an estimated regression equation with the amount of television advertising as the independent variable. Let x represent the amount of television advertising. If required, round your answers to three decimal places. For subtractive or negative numbers use a minus sign even if there is a + sign before the blank. (Example: 300) y^= iven the (b) How much of the variation in the sample values of weekly gross revenue does the model in part (a) explain ir answer to two decimal places. (c) Use the data to develop an estimated regression equation with both television advertising and newspaper advertising as the independent variables. Let x1 represent the amount of television advertising. Let x2 represent the amount of newspaper advertising. If reauired. round vour answers to three decimal places. y^= (d) How much of the variation in the sample values of weekly gross revenue does the model in part (c) explain? Ir answer to two decimal places. (e) Given the results in part (a) and part (c), what should your next step be? Explain. The input in the box below will not be graded, but may be reviewed and considered by your instructor. (f) What are the managerial implications of these results? Management can feel confident that increased spending on both television and newspaper V advertising results in increased weekly gross revenue. The results also suggest that Jadvertising may be slightly more effective thar |advertising in generating revenue