

Answered step by step
Verified Expert Solution
Question
1 Approved Answer
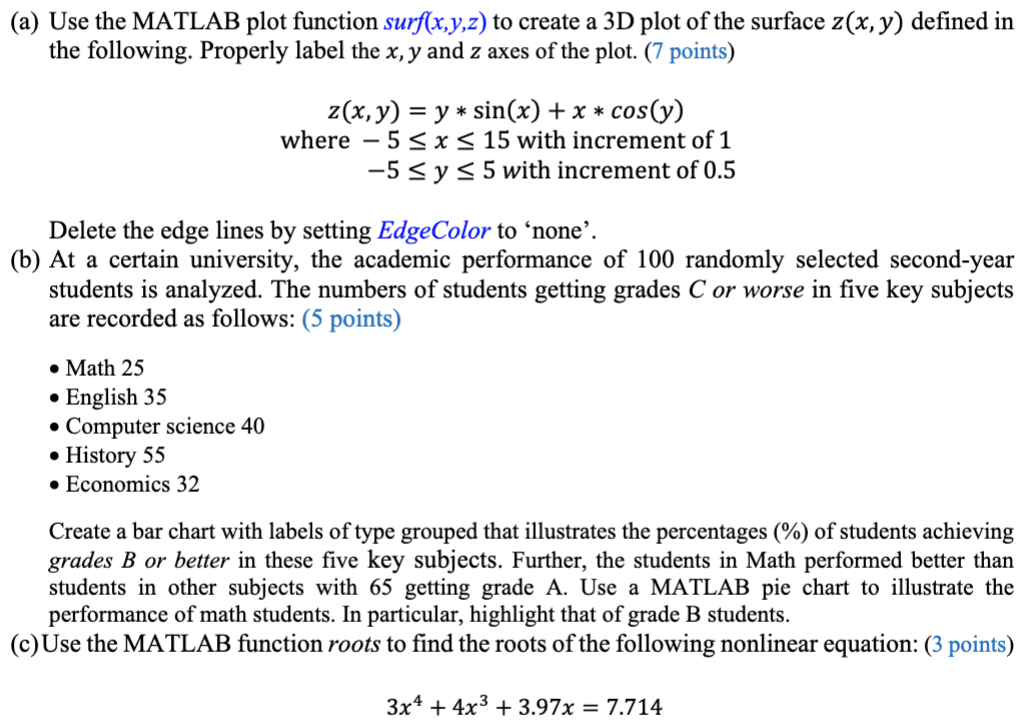
(a) Use the MATLAB plot function surf(x,y,z) to create a 3D plot of the surface z(x,y) defined in the following. Properly label the x,y and
Step by Step Solution
There are 3 Steps involved in it
Step: 1

Get Instant Access to Expert-Tailored Solutions
See step-by-step solutions with expert insights and AI powered tools for academic success
Step: 2

Step: 3
Ace Your Homework with AI
Get the answers you need in no time with our AI-driven, step-by-step assistance
Get Started
Fundamentals Of Database Management Systems
Authors: Mark L. Gillenson
2nd Edition
0470624701, 978-0470624708