Answered step by step
Verified Expert Solution
Question
1 Approved Answer
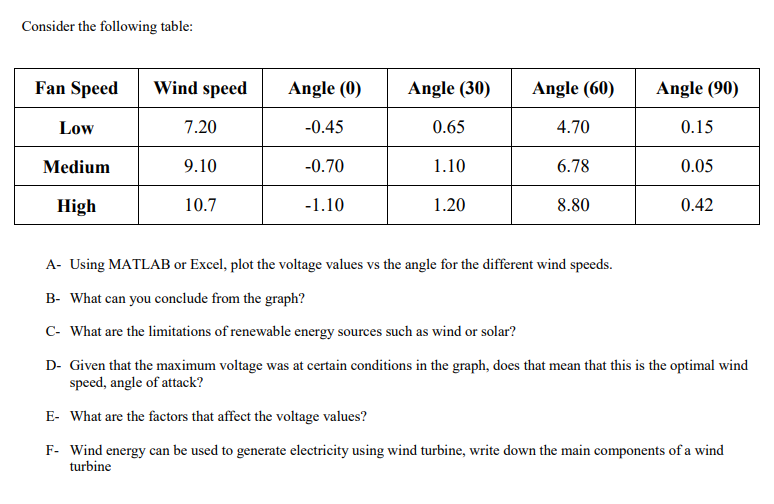
A- Using MATLAB or Excel, plot the voltage values vs the angle for the different wind speeds. B- What can you conclude from the graph?

A- Using MATLAB or Excel, plot the voltage values vs the angle for the different wind speeds.
B- What can you conclude from the graph?
C- What are the limitations of renewable energy sources such as wind or solar?
D- Given that the maximum voltage was at certain conditions in the graph, does that mean that this is the optimal wind speed, angle of attack?
E- What are the factors that affect the voltage values?
F- Wind energy can be used to generate electricity using wind turbine, write down the main components of a wind turbine
Consider the following table: Fan Speed Wind speed Angle (0) Angle (30) Angle (60) Angle (90) Low 7.20 -0.45 0.65 4.70 0.15 Medium 9.10 -0.70 1.10 6.78 0.05 High 10.7 -1.10 1.20 8.80 0.42 A- Using MATLAB or Excel, plot the voltage values vs the angle for the different wind speeds. B- What can you conclude from the graph? C- What are the limitations of renewable energy sources such as wind or solar? D- Given that the maximum voltage was at certain conditions in the graph, does that mean that this is the optimal wind speed, angle of attack? E- What are the factors that affect the voltage values? F- Wind energy can be used to generate electricity using wind turbine, write down the main components of a wind turbineStep by Step Solution
There are 3 Steps involved in it
Step: 1

Get Instant Access to Expert-Tailored Solutions
See step-by-step solutions with expert insights and AI powered tools for academic success
Step: 2

Step: 3

Ace Your Homework with AI
Get the answers you need in no time with our AI-driven, step-by-step assistance
Get Started


