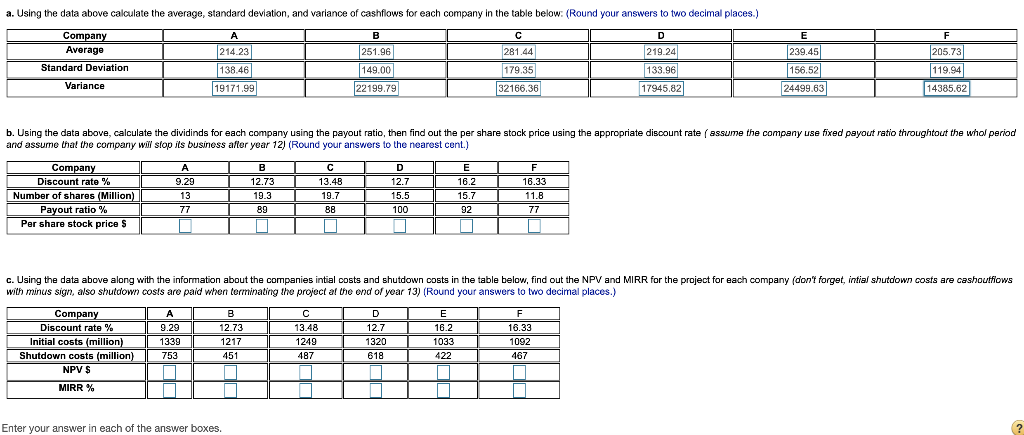
a. Using the data above calculate the average, standard deviation, and variance of cashflows for each company in the table below: (Round your answers to two decimal places.) Company A Average 214.23 251.96 281.44 219.24 Standard Deviation 138.46 149.00 179.35 133.96 Variance 19171.99 22199.79 32166.36 17945.82 239.45 156.52 24499.63 205.73 119.94 14385.62 b. Using the data above, calculate the dividinds for each company using the payout ratio, then find out the per share stock price using the appropriate discount rate ( assume the company use fixed payout ratio throughout the whol period and assume that the company will slop its business after year 12) (Round your answers to the nearest cent.) L Company Discount rate % Number of shares (Million) Payout ratio % Per share stock prices A 9.29 13 77 c DELF 12.73 13.48 12.7 16.2 16.33 1 15.5 15.7 11.8 8988 100 N92177 c. Using the data above along with the information about the companies intial costs and shutdown costs in the table below, find out the NPV and MIRR for the project for each company (don't forget, intial shutdown costs are cashoutflows with minus sign, also shutdown costs are paid when terminating the project at the end of year 13) (Round your answers to two decimal places.) Company Discount rate % Initial costs (million) Shutdown costs (million) NPV $ AB C 9.29L 12.73 1339 1 217 753 451 DE 12.7 T 16.2 1320 1033 618 422 13.48 249 487 1 16.33 1092 467 MIRR % Enter your answer in each of the answer boxes. a. Using the data above calculate the average, standard deviation, and variance of cashflows for each company in the table below: (Round your answers to two decimal places.) Company A Average 214.23 251.96 281.44 219.24 Standard Deviation 138.46 149.00 179.35 133.96 Variance 19171.99 22199.79 32166.36 17945.82 239.45 156.52 24499.63 205.73 119.94 14385.62 b. Using the data above, calculate the dividinds for each company using the payout ratio, then find out the per share stock price using the appropriate discount rate ( assume the company use fixed payout ratio throughout the whol period and assume that the company will slop its business after year 12) (Round your answers to the nearest cent.) L Company Discount rate % Number of shares (Million) Payout ratio % Per share stock prices A 9.29 13 77 c DELF 12.73 13.48 12.7 16.2 16.33 1 15.5 15.7 11.8 8988 100 N92177 c. Using the data above along with the information about the companies intial costs and shutdown costs in the table below, find out the NPV and MIRR for the project for each company (don't forget, intial shutdown costs are cashoutflows with minus sign, also shutdown costs are paid when terminating the project at the end of year 13) (Round your answers to two decimal places.) Company Discount rate % Initial costs (million) Shutdown costs (million) NPV $ AB C 9.29L 12.73 1339 1 217 753 451 DE 12.7 T 16.2 1320 1033 618 422 13.48 249 487 1 16.33 1092 467 MIRR % Enter your answer in each of the answer boxes