

Answered step by step
Verified Expert Solution
Question
1 Approved Answer
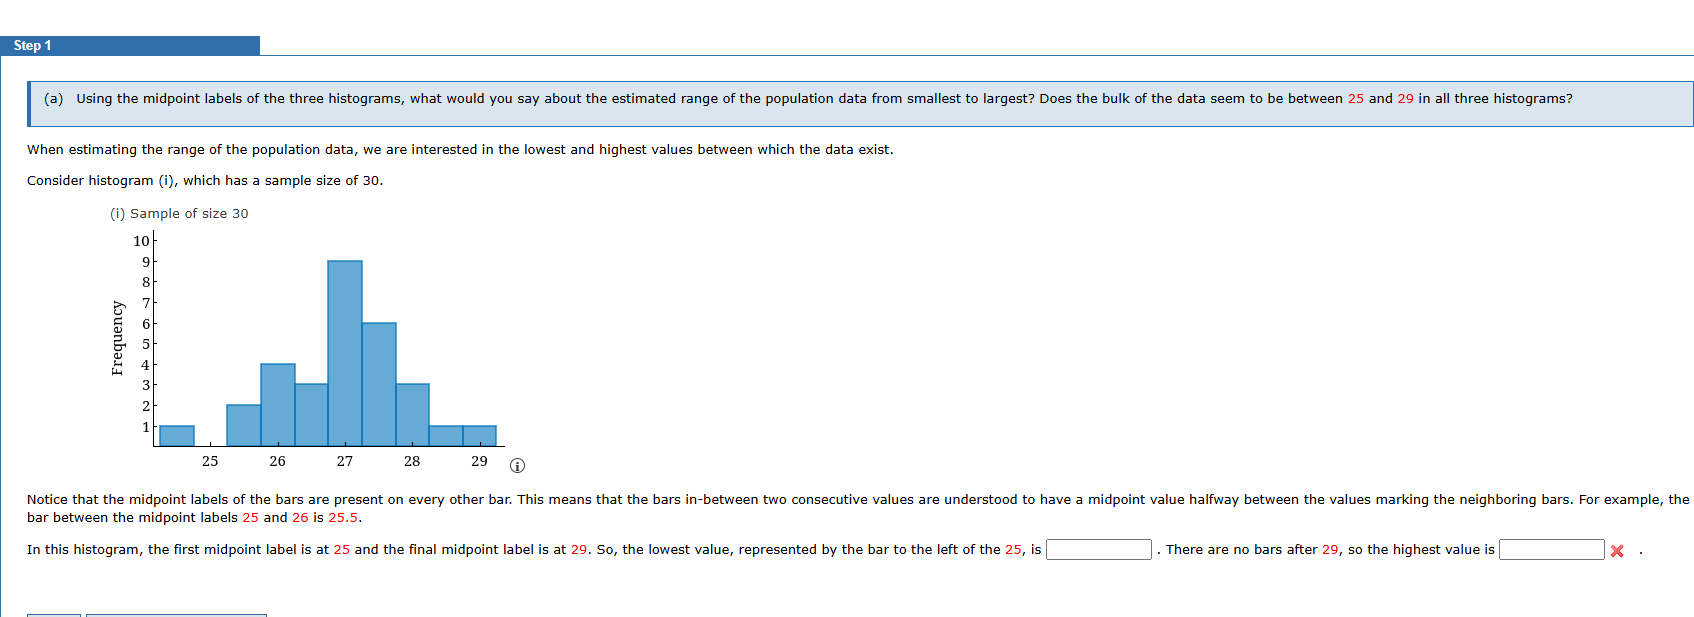
(a) Using the midpoint labels of the three histograms, what would you say about the estimated range of the population data from smallest to largest?
Step by Step Solution
There are 3 Steps involved in it
Step: 1

Get Instant Access to Expert-Tailored Solutions
See step-by-step solutions with expert insights and AI powered tools for academic success
Step: 2

Step: 3
Ace Your Homework with AI
Get the answers you need in no time with our AI-driven, step-by-step assistance
Get Started
Algebra and Trigonometry
Authors: Ron Larson
10th edition
9781337514255, 1337271179, 133751425X, 978-1337271172