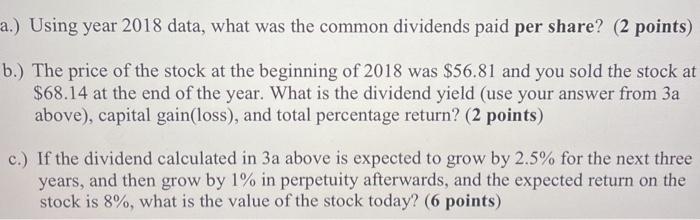
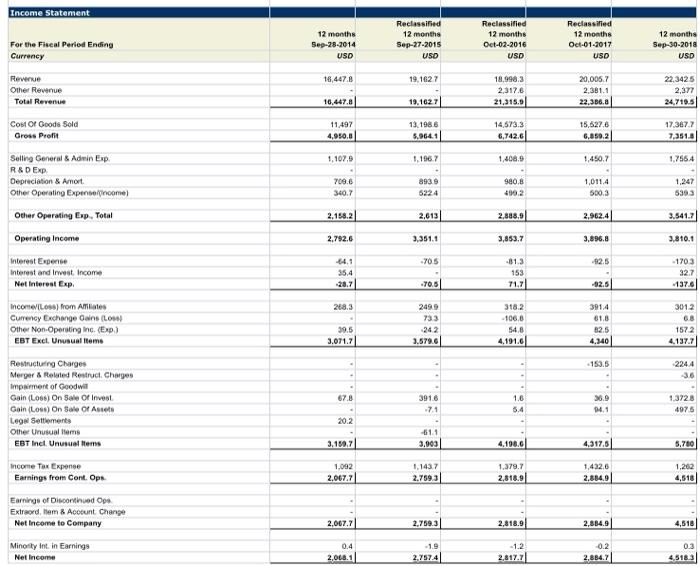
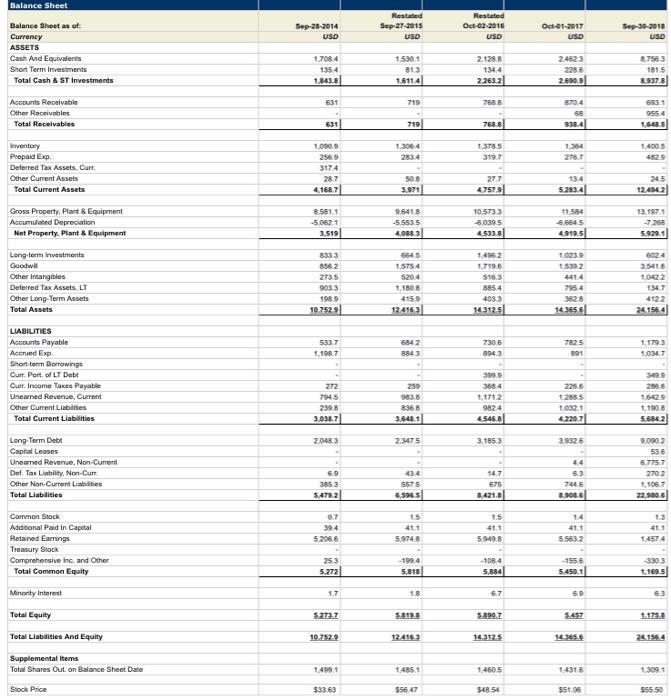
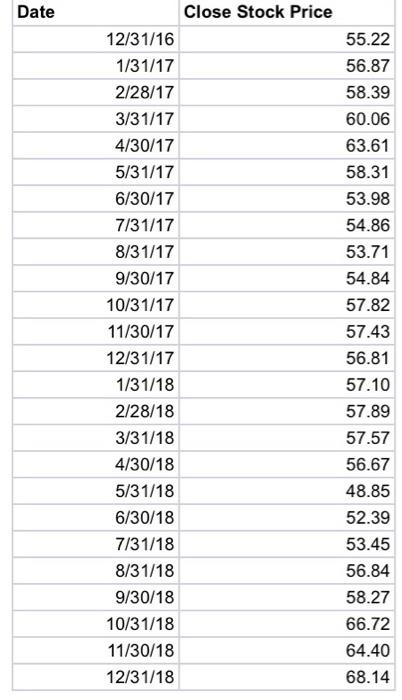
a.) Using year 2018 data, what was the common dividends paid per share? (2 points) b.) The price of the stock at the beginning of 2018 was $56.81 and you sold the stock at $68.14 at the end of the year. What is the dividend yield (use your answer from 3a above), capital gain(loss), and total percentage return? (2 points) c.) If the dividend calculated in 3a above is expected to grow by 2.5% for the next three years, and then grow by 1% in perpetuity afterwards, and the expected return on the stock is 8%, what is the value of the stock today? (6 points) Income Statement For the Fiscal Period Ending Currency 12 months Sep-28-2014 USD Reclassified 12 months Sep-27-2015 USD Reclassified 12 months Oct-02-2016 USD Reclassified 12 months Oct-01-2017 USD 12 months Sep-30-2018 USD 18,447.8 19,1627 Reverse Other Revenue Total Revenue 18,998.3 2.317.6 21,315.0 20,006.7 2.381.1 22.336.8 22.3425 2,377 24.719.5 16,447.81 19.162.7 Cost Of Goods Sold Gross Profit 11497 4,950.0 13.1986 5.964.1 14,573,3 6.742.6 15.627.6 6.850.2 17.367.7 7.351.0 1.107.9 1.1967 1.408.9 1,450.7 1.7564 Selling General & Admin Exp R&D EXP Depreciation & Amort Other Operating Expertencome) 7096 1,011.4 8939 5224 340.7 980.8 490.2 1,247 5393 5003 Other Operating Exp. Total 2.158.2 2,613 2.888.0 2.962.4 3.541.7 Operating Income 2.792.6 3.351.1 3,853.7 3,096.8 3.810.1 .705 92.5 - 1703 Interest Expense Interest and Inwest Income Net Interest Exp -64.1 35.4 -31.3 153 71.7 -70.5 -92.5 -1376 268.3 Income Los) from Ames Currency Exchange Gains (Los) Other Non-Operating Inc. (Exp) EBT Excl. Unusual Items 2499 733 242 3.579.6 39.5 3.071.71 318,2 -106.6 54.8 4,191.6 391.4 61.8 12.5 4.340 3012 68 1572 4.1377 -153.5 224.4 36 Restructuring Charges Merger & Related Restruct. Charges Impament of Goodwin Gain (L08) On Sale Of Invest Goin (Loss) On Sale Of Assets Legal Settlements Other Unusual Hems EBT Incl. Unusual Items 3916 -71 1.6 5.4 36.9 14.1 1.3728 4975 20.2 -61.1 3.903 3.150.7 4.198.6 4.317.6 5.780 Income Tax Expense Earnings from Cont. Ops 1.092 2.067.7 1.1437 2.7593 1.379.7 2.818.9 1.432.6 2.884.9 1,202 4,518 Earnings of Discontinued Ops Extraord, Hem & Account Change Net Income to Company 2.067.7 2.759.3 2.818.9 2,884.9 4,510 0.3 Minority Int. In Earnings Net Income 0.4 2.018.1 -1.9 2.7574 -1.2 2,817.21 -0.2 2,884.7 4.5183 Balance Sheet Sep-28-2014 USD Restated Sep-27-2015 USD Restated Oct-02-2010 USD Oct-01-2017 USD Sep-3-2010 USO Balance Sheet as of Currency ASSETS Cash And Equivalents Short Term Investments Total Cash & ST Investments 1.7084 135.4 1.843.8 1.530.1 813 1.6114 2.128.6 134.4 2.263.2 2.4623 2286 2.6909 8.7563 1615 8.937 8 631 719 7688 Accounts Receivable Other Receivables Total Receivables 8704 50 631 9554 16S 631 719 768.6 1400 5 1.306.4 2834 1.378.5 319. 1354 21.7 Inventory Prepaid Exp. Deferred Tax Assets Curr Other Current Assets Total Current Assets 1.000 2569 317.4 28.7 4.168.7 508 3.971 27.7 475791 13.4 5.283.41 12.4542 Gross Property Plant & Equipment Accumulated Depreciation Not Property. Plant & Equipment 8.581.1 -5.062 1 3,519 9.6418 -5.5535 4,0883 105733 50395 4,533.8| 11 594 66645 49195 13.1970 -7.250 59200 8362 273,5 9033 GES 1.575.4 5204 1.1808 4155 12.4153 1436.2 1.719.6 5163 885.4 4033 14.3125 1023 55392 4414 795.4 3628 14.3656 3.54416 10022 1347 4122 24 1564 10752 Long-term investments Goodw Other Intangibles Deferred Tax Assets, LT Other Long Term Assets Total Assets LIABILITIES Accounts Payable Accrued Exp , Short term Borrowing Curr. Port of LT Debt Curr.Income Taxes Payable Unearned Revenue, Current Other Current Liabilities Total Current Liabilities 5337 1.1987 6842 8843 7306 8943 7825 191 1.1793 10347 250 2256 272 7545 2396 3.038.7 399.. 3684 1,1712 9824 4,545.8 30 2856 1.6520 1.1908 5.6542 8368 3.548.1 10321 42207 20483 2.3475 3.185 3 3.9325 Long-Term Debt Capital Leases Uneamed Revenue, Non-Current Def. Tax Liability. Non-Cum Other Non Current Lisbites Total Liabilities 6.9 3853 5471 2 43.4 5575 6,596.5 9.090.2 536 6.7757 2702 106.7 22.000 6 54.7 675 3421.00 63 7445 8.900.0 1.5 1.5 41.1 59498 13 411 394 52066 411 5.5632 5.9748 Common Stock Additional Paid in Capital Retaned Earnings Treasury Shock Comprehensive Inc. and Other Total Common Equity 253 5.272 -1994 5.818 -1084 5,884 -155.6 5.450.11 3803 1169.5 Minority Interest 1.7 18 6.7 60 Total Equity 5273.7 5.419 5.0907 5497 1.175.0 Total Liabilities And Equity 10.7529 124163 14.3125 14.365.6 241564 Supplemental Items Total Shares Out. on Balance Sheet Date 1.450.5 13091 Stock Price 33363 $56.47 SEB 54 55100 Cash Flow For the Fiscal Period Ending Currency 12 months Sep-20-2014 USD 12 months Sep-27-2015 USD Restated 12 months Oct-02-2016 USD Restated 12 months Oct-01-2017 USD 12 months Sep-30-2012 USD Net Income Deprecision & Amort Amort of Goodall and intangibles Depreciation & Amort, Total 2,068.1 739.7 8.7 748.41 2.757.4 183.8 50 933.8 2,817.7 9728 57.3 1,030.1 2.884.7 1.000.0 57.5 1.067.1 4,518.3 1.1194 1865 1,305.9 6.1 -93.5 -3.7 -390.6 -70.2 872 123.6 176 4992 - 1,376.4 37.6 -16 250.3 218.1 (Gain) Loss From Sale or Assets Gain) Loss On Sale Of Invest Asset Witedown & Restructuring Costs (Income) Lowon Equity Invest Stock-Based Compensation Tow Benefit from Stock Option Other Operating Activiti Change in Acc. Receivable Change in Irritories Change in Acc. Payable Change in Unearned Change in Other Net Operating Assets Cash from Ops. 312 43.8 183.2 - 114.4 46 79.7 14.3 00.4 140.8 2.3456 607.0 42 2008 -132.4 138 82.8 207.9 1377 170.3 201.5 3.749.1 -556 -675 469 1804 248.8 4,6979 1642 06.8 14 46.4 130.0 -47 4.251.8 8036 131 412 3916 7,109.4 -6771 11.937.8 - 1,100.0 1,4403 -1519.4 -1.3037 284.3 Capital Expenditure Cash Acquisitions Divestitures Invest in Marketable & Equity Securt Net (ing) Dec. in Loont OriginatedSold Other Investing Activities Cash from investing . 1.176.4 -1.3113 0002 3124 3623 60.9 090 -8771 05.4 5297 19.1 .817.21 6.8 -1.520.3 249 -2.2229 54.3 -850 5.6 2,361.5 748.5 748.6 848.5 148.5 1,2545 1.254.5 Short Term Debt issued Long-Term Deblowed Total Debt issued Short Term Debt Repaid Long-Term Debt Repaid Total Debt Repaid 750.2 750.2 5,5811 5,584.1 -610.1 .610.1 400 400 101.8 153.0 Isance of Conmon Stock Repurchase of Common Stock 139.7 -8350 1007 2,101.6 150.0 2.125.3 . 178 Common Dividende Pad Total Dividends Paid -7831 .783.11 928.6 -920.6 -1450.4 -1450.4 -1.743.4 1,743.4 Special Dividend Paid Omer Financing Activities Cash from Financing 2465 1078 6233 -4.4 3.070.1 -412 3.242.8 1,0720 Foreign Exchange Rate Adj Net Change In Cash -1500 1782 -25 590 10.8 333.0 30.5 6.294 -067 Date 55.22 56.87 58.39 60.06 Close Stock Price 12/31/16 1/31/17 2/28/17 3/31/17 4/30/17 5/31/17 6/30/17 7/31/17 8/31/17 9/30/17 10/31/17 11/30/17 12/31/17 1/31/18 2/28/18 3/31/18 4/30/18 5/31/18 6/30/18 7/31/18 8/31/18 9/30/18 10/31/18 11/30/18 12/31/18 63.61 58.31 53.98 54.86 53.71 54.84 57.82 57.43 56.81 57.10 57.89 57.57 56.67 48.85 52.39 53.45 56.84 58.27 66.72 64.40 68.14