Answered step by step
Verified Expert Solution
Question
1 Approved Answer
a) What does it mean to repeat for the quadrature? I suspect I will be plotting the random samples against their indexes for the first

a) What does it mean to repeat for the quadrature? I suspect I will be plotting the random samples against their indexes for the first sentence. How would I get the noise envelope? How is the envelope different from the noise?
b,c,d,e,f) what equations would I need to answer these? what data would I need to derive? I don't understand the question enough to get any traction here. I'd ask the Professor but the assignment is already late
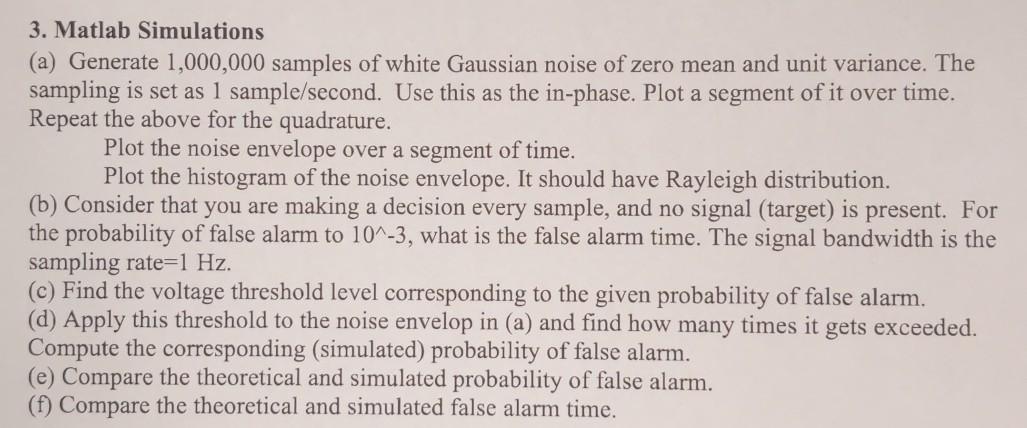
3. Matlab Simulations (a) Generate 1,000,000 samples of white Gaussian noise of zero mean and unit variance. The sampling is set as 1 sample/second. Use this as the in-phase. Plot a segment of it over time. Repeat the above for the quadrature. Plot the noise envelope over a segment of time. Plot the histogram of the noise envelope. It should have Rayleigh distribution. (b) Consider that you are making a decision every sample, and no signal (target) is present. For the probability of false alarm to 10^-3, what is the false alarm time. The signal bandwidth is the sampling rate=1 Hz. (c) Find the voltage threshold level corresponding to the given probability of false alarm. (d) Apply this threshold to the noise envelop in (a) and find how many times it gets exceeded. Compute the corresponding (simulated) probability of false alarm. (e) Compare the theoretical and simulated probability of false alarm. (f) Compare the theoretical and simulated false alarm time. 3. Matlab Simulations (a) Generate 1,000,000 samples of white Gaussian noise of zero mean and unit variance. The sampling is set as 1 sample/second. Use this as the in-phase. Plot a segment of it over time. Repeat the above for the quadrature. Plot the noise envelope over a segment of time. Plot the histogram of the noise envelope. It should have Rayleigh distribution. (b) Consider that you are making a decision every sample, and no signal (target) is present. For the probability of false alarm to 10^-3, what is the false alarm time. The signal bandwidth is the sampling rate=1 Hz. (c) Find the voltage threshold level corresponding to the given probability of false alarm. (d) Apply this threshold to the noise envelop in (a) and find how many times it gets exceeded. Compute the corresponding (simulated) probability of false alarm. (e) Compare the theoretical and simulated probability of false alarm. (f) Compare the theoretical and simulated false alarm timeStep by Step Solution
There are 3 Steps involved in it
Step: 1

Get Instant Access to Expert-Tailored Solutions
See step-by-step solutions with expert insights and AI powered tools for academic success
Step: 2

Step: 3

Ace Your Homework with AI
Get the answers you need in no time with our AI-driven, step-by-step assistance
Get Started


