

Answered step by step
Verified Expert Solution
Question
1 Approved Answer
a. What is the depreciation deduction for each asset in 2019? b. Compute the gain or loss on each asset sold. Reference - X General
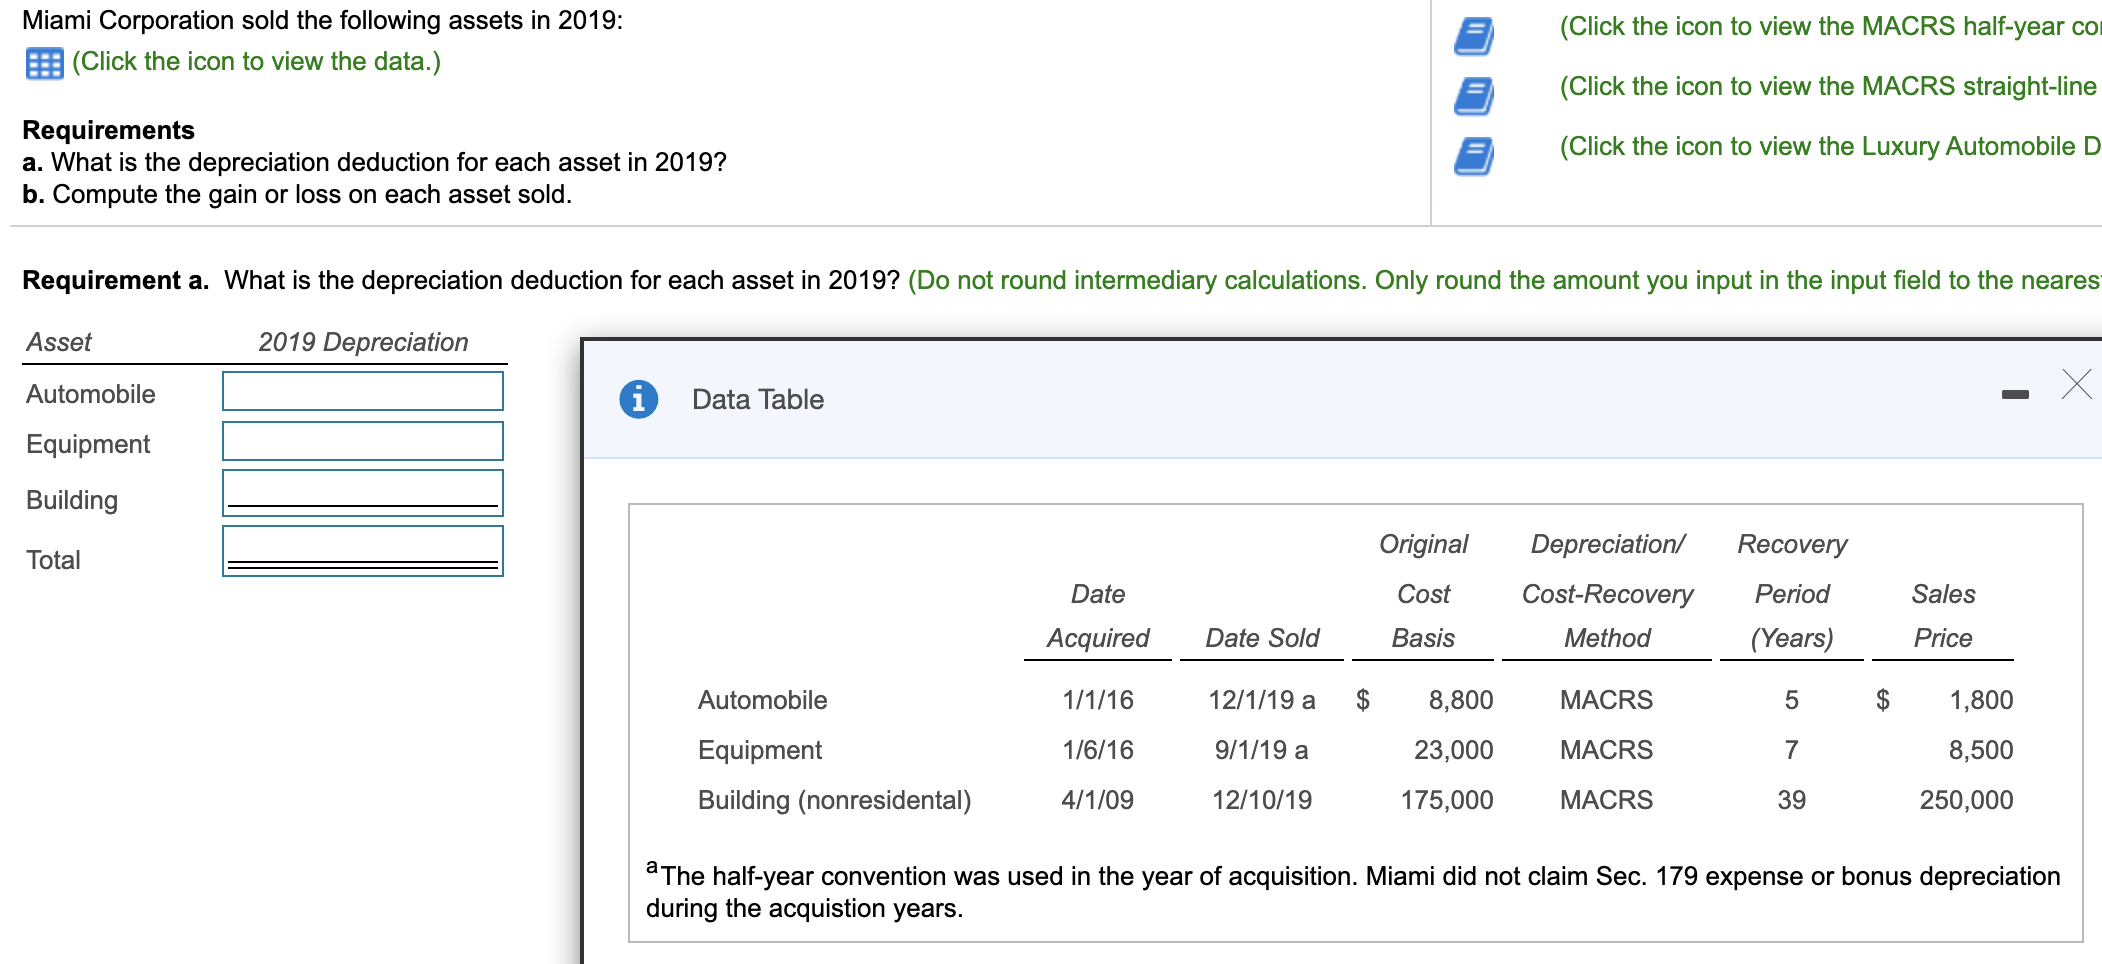
a. What is the depreciation deduction for each asset in 2019?
b. Compute the gain or loss on each asset sold.
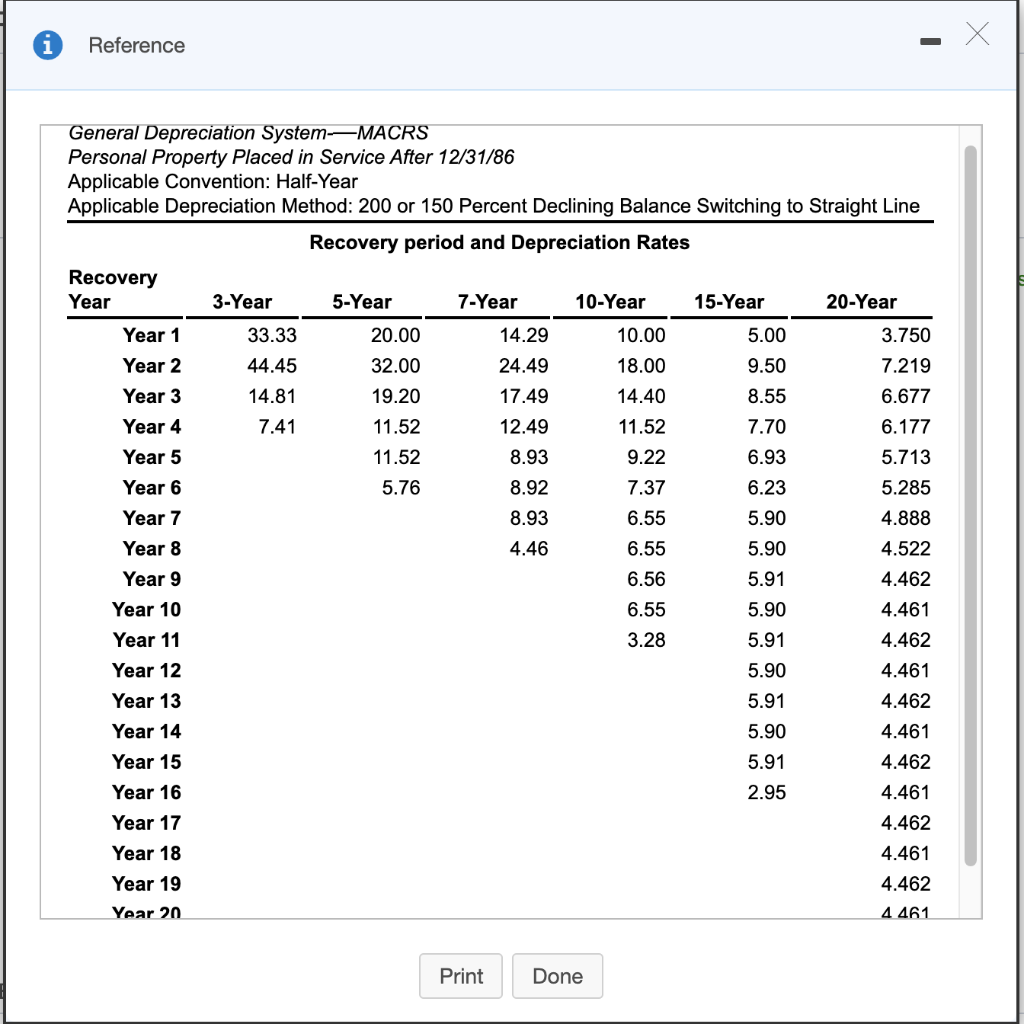
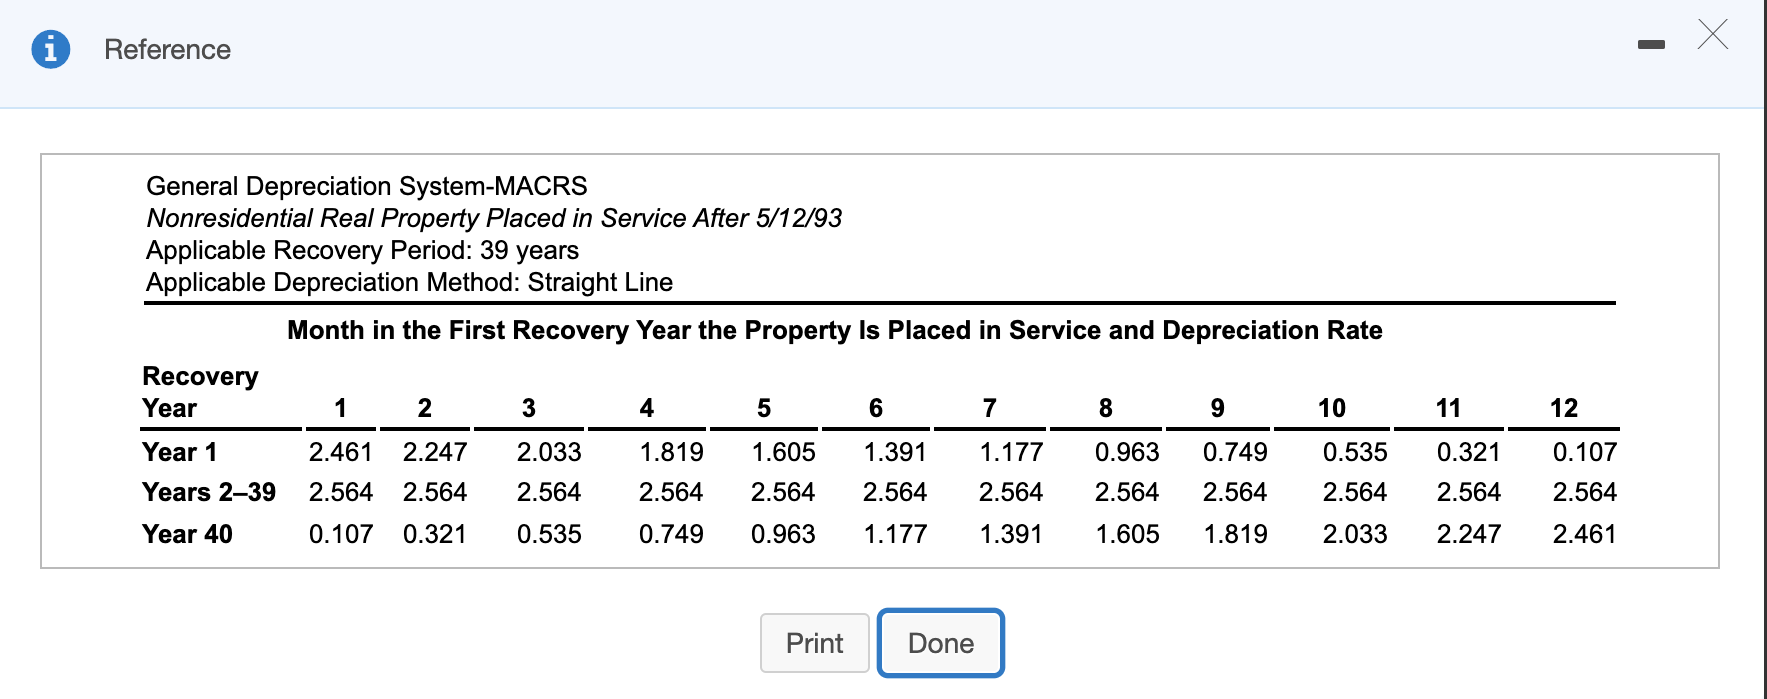
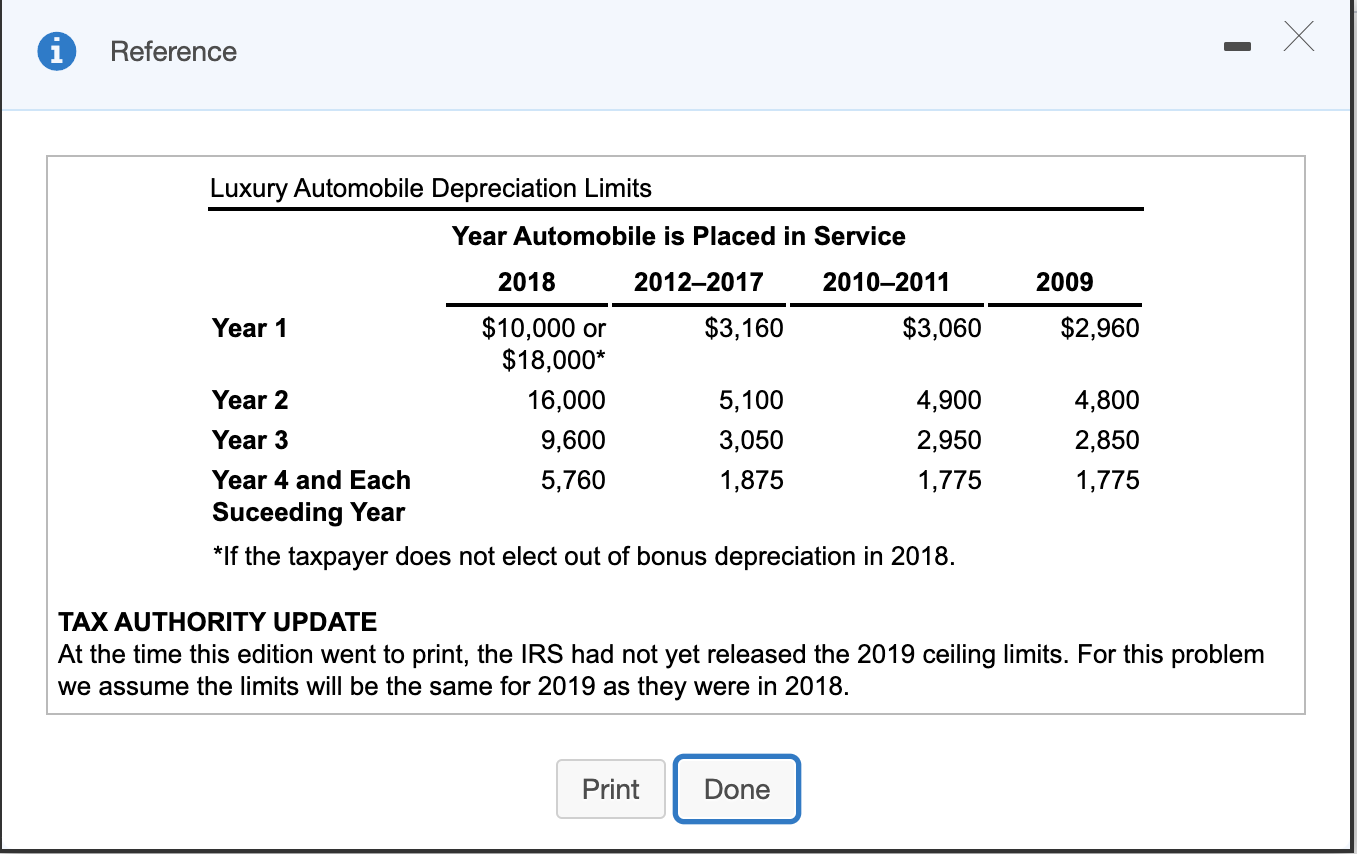
Reference - X General Depreciation System--MACRS Personal Property Placed in Service After 12/31/86 Applicable Convention: Half-Year Applicable Depreciation Method: 200 or 150 Percent Declining Balance Switching to Straight Line Recovery period and Depreciation Rates Recovery Year 3-Year 5-Year 7-Year 10-Year 15-Year 20-Year Year 1 33.33 20.00 14.29 10.00 5.00 3.750 Year 2 44.45 32.00 24.49 18.00 9.50 7.219 Year 3 14.81 19.20 17.49 14.40 8.55 6.677 Year 4 7.41 11.52 12.49 11.52 7.70 6.177 Year 5 11.52 8.93 9.22 6.93 5.713 Year 6 5.76 8.92 7.37 6.23 5.285 Year 7 8.93 6.55 5.90 4.888 Year 8 4.46 6.55 5.90 4.522 Year 9 6.56 5.91 4.462 Year 10 6.55 5.90 4.461 Year 11 3.28 5.91 4.462 Year 12 5.90 4.461 Year 13 5.91 4.462 Year 14 5.90 4.461 Year 15 5.91 4.462 Year 16 2.95 4.461 Year 17 4.462 Year 18 4.461 Year 19 4.462 Year 20 4.461 Print Done Miami Corporation sold the following assets in 2019: (Click the icon to view the data.) (Click the icon to view the MACRS half-year com (Click the icon to view the MACRS straight-line (Click the icon to view the Luxury Automobile D Requirements a. What is the depreciation deduction for each asset in 2019? b. Compute the gain or loss on each asset sold. Requirement a. What is the depreciation deduction for each asset in 2019? (Do not round intermediary calculations. Only round the amount you input in the input field to the neares Asset 2019 Depreciation Data Table Automobile Equipment -X Building Total Original Cost Basis Date Acquired Depreciation/ Cost-Recovery Method Recovery Period (Years) Sales Date Sold Price Automobile 1/1/16 12/1/19 a $ 5 $ 1,800 1/6/16 9/1/19 a 8,800 23,000 175,000 MACRS MACRS MACRS Equipment Building (nonresidental) 7 8,500 4/1/09 12/10/19 39 250,000 a The half-year convention was used in the year of acquisition. Miami did not claim Sec. 179 expense or bonus depreciation during the acquistion years. x Reference General Depreciation System-MACRS Nonresidential Real Property Placed in Service After 5/12/93 Applicable Recovery Period: 39 years Applicable Depreciation Method: Straight Line Month in the First Recovery Year the Property Is Placed in Service and Depreciation Rate Recovery Year 1 2 3 4 5 6 7 8 9 10 Year 1 2.461 2.247 2.033 1.819 1.605 1.391 1.177 0.963 0.749 0.535 Years 239 2.564 2.564 2.564 2.564 2.564 2.564 2.564 2.564 2.564 2.564 Year 40 0 .107 0.321 0.535 0.749 0.963 1.177 1.391 1.605 1.819 2.033 11 0.321 2.564 2.247 12 0.107 2.564 2.461 Print Done i Reference Luxury Automobile Depreciation Limits Year Automobile is placed in Service 2009 $2,960 2018 2012-2017 2010-2011 Year 1 $10,000 or $3,160 $3,060 $18,000* Year 2 16,000 5,100 4,900 Year 3 9,600 3,050 2,950 Year 4 and Each 5,760 1,875 Suceeding Year *If the taxpayer does not elect out of bonus depreciation in 2018. 4,800 2,850 1.775 1,775 TAX AUTHORITY UPDATE At the time this edition went to print, the IRS had not yet released the 2019 ceiling limits. For this problem we assume the limits will be the same for 2019 as they were in 2018. Print Done Reference - X General Depreciation System--MACRS Personal Property Placed in Service After 12/31/86 Applicable Convention: Half-Year Applicable Depreciation Method: 200 or 150 Percent Declining Balance Switching to Straight Line Recovery period and Depreciation Rates Recovery Year 3-Year 5-Year 7-Year 10-Year 15-Year 20-Year Year 1 33.33 20.00 14.29 10.00 5.00 3.750 Year 2 44.45 32.00 24.49 18.00 9.50 7.219 Year 3 14.81 19.20 17.49 14.40 8.55 6.677 Year 4 7.41 11.52 12.49 11.52 7.70 6.177 Year 5 11.52 8.93 9.22 6.93 5.713 Year 6 5.76 8.92 7.37 6.23 5.285 Year 7 8.93 6.55 5.90 4.888 Year 8 4.46 6.55 5.90 4.522 Year 9 6.56 5.91 4.462 Year 10 6.55 5.90 4.461 Year 11 3.28 5.91 4.462 Year 12 5.90 4.461 Year 13 5.91 4.462 Year 14 5.90 4.461 Year 15 5.91 4.462 Year 16 2.95 4.461 Year 17 4.462 Year 18 4.461 Year 19 4.462 Year 20 4.461 Print Done Miami Corporation sold the following assets in 2019: (Click the icon to view the data.) (Click the icon to view the MACRS half-year com (Click the icon to view the MACRS straight-line (Click the icon to view the Luxury Automobile D Requirements a. What is the depreciation deduction for each asset in 2019? b. Compute the gain or loss on each asset sold. Requirement a. What is the depreciation deduction for each asset in 2019? (Do not round intermediary calculations. Only round the amount you input in the input field to the neares Asset 2019 Depreciation Data Table Automobile Equipment -X Building Total Original Cost Basis Date Acquired Depreciation/ Cost-Recovery Method Recovery Period (Years) Sales Date Sold Price Automobile 1/1/16 12/1/19 a $ 5 $ 1,800 1/6/16 9/1/19 a 8,800 23,000 175,000 MACRS MACRS MACRS Equipment Building (nonresidental) 7 8,500 4/1/09 12/10/19 39 250,000 a The half-year convention was used in the year of acquisition. Miami did not claim Sec. 179 expense or bonus depreciation during the acquistion years. x Reference General Depreciation System-MACRS Nonresidential Real Property Placed in Service After 5/12/93 Applicable Recovery Period: 39 years Applicable Depreciation Method: Straight Line Month in the First Recovery Year the Property Is Placed in Service and Depreciation Rate Recovery Year 1 2 3 4 5 6 7 8 9 10 Year 1 2.461 2.247 2.033 1.819 1.605 1.391 1.177 0.963 0.749 0.535 Years 239 2.564 2.564 2.564 2.564 2.564 2.564 2.564 2.564 2.564 2.564 Year 40 0 .107 0.321 0.535 0.749 0.963 1.177 1.391 1.605 1.819 2.033 11 0.321 2.564 2.247 12 0.107 2.564 2.461 Print Done i Reference Luxury Automobile Depreciation Limits Year Automobile is placed in Service 2009 $2,960 2018 2012-2017 2010-2011 Year 1 $10,000 or $3,160 $3,060 $18,000* Year 2 16,000 5,100 4,900 Year 3 9,600 3,050 2,950 Year 4 and Each 5,760 1,875 Suceeding Year *If the taxpayer does not elect out of bonus depreciation in 2018. 4,800 2,850 1.775 1,775 TAX AUTHORITY UPDATE At the time this edition went to print, the IRS had not yet released the 2019 ceiling limits. For this problem we assume the limits will be the same for 2019 as they were in 2018. Print DoneStep by Step Solution
There are 3 Steps involved in it
Step: 1

Get Instant Access to Expert-Tailored Solutions
See step-by-step solutions with expert insights and AI powered tools for academic success
Step: 2

Step: 3
Ace Your Homework with AI
Get the answers you need in no time with our AI-driven, step-by-step assistance
Get Started
Culture Audits Supporting Organizational Success Information Line
Authors: Cynthia Solomon
1st Edition
156286386X, 978-1562863869