Answered step by step
Verified Expert Solution
Question
1 Approved Answer
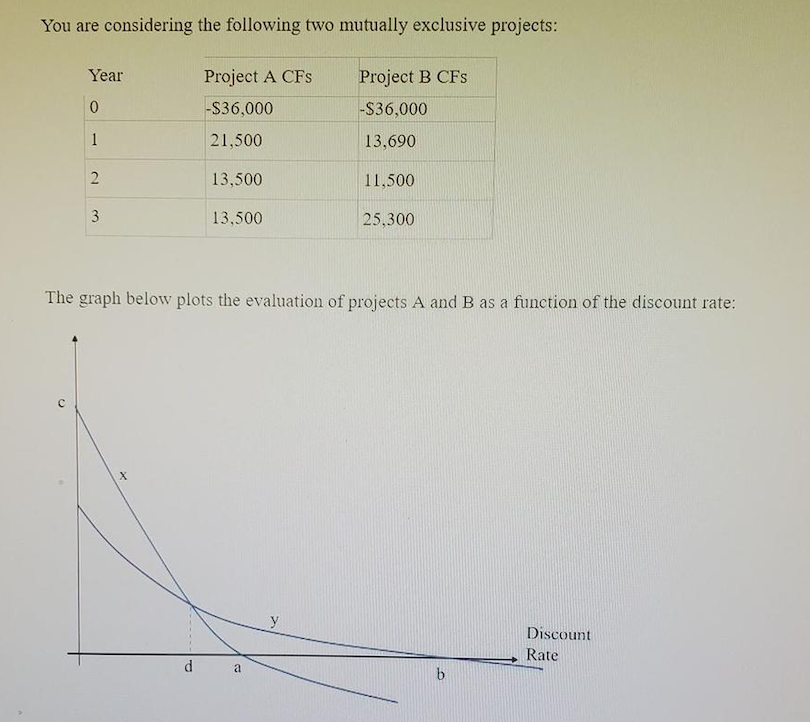
A) What is the label on the vertical axis? B) Which project does curve x represent, A or B? How about curve y? C) Whats

A) What is the label on the vertical axis?
B) Which project does curve x represent, A or B? How about curve y?
C) Whats the value of point c?
D) What is the name and value of point a?
You are considering the following two mutually exclusive projects: Year Project B CFS 0 Project A CFs -$36,000 21,500 -S36,000 13,690 2 13,500 11,500 3 13,500 25,300 The graph below plots the evaluation of projects A and B as a function of the discount rate: Discount Rate d a bStep by Step Solution
There are 3 Steps involved in it
Step: 1

Get Instant Access to Expert-Tailored Solutions
See step-by-step solutions with expert insights and AI powered tools for academic success
Step: 2

Step: 3

Ace Your Homework with AI
Get the answers you need in no time with our AI-driven, step-by-step assistance
Get Started


