A. What is the most recent year-end for 3M? Why does this date seem reasonable?
B. Compute these ratios for 3M. Use the most recent year-end. Note: Please show all of your work. Show the ratio formula and the numbers that go in the formula, any relevant averages or subtotals, and the result. Indicate if the result is stated in dollars, a percent, or something else.
-Earnings Quality
-Inventory Turnover
-Average Days to Sell Inventory
-Return on Equity
-Return on Sales
-Quick
-Debt
-Debt to equity
-Times Interest Earned
C. Consider the impact of Covid-19 on the financial results of 3M. In particular.
3M discusses factors related to Covid-19 that affected its financial results, both in a negative way and in a positive way. Using your own words (not cutting and pasting), please answer these two questions:
- What are some negative effects of the pandemic on the financial results?
- What are some positive effects of the pandemic on the financial results?
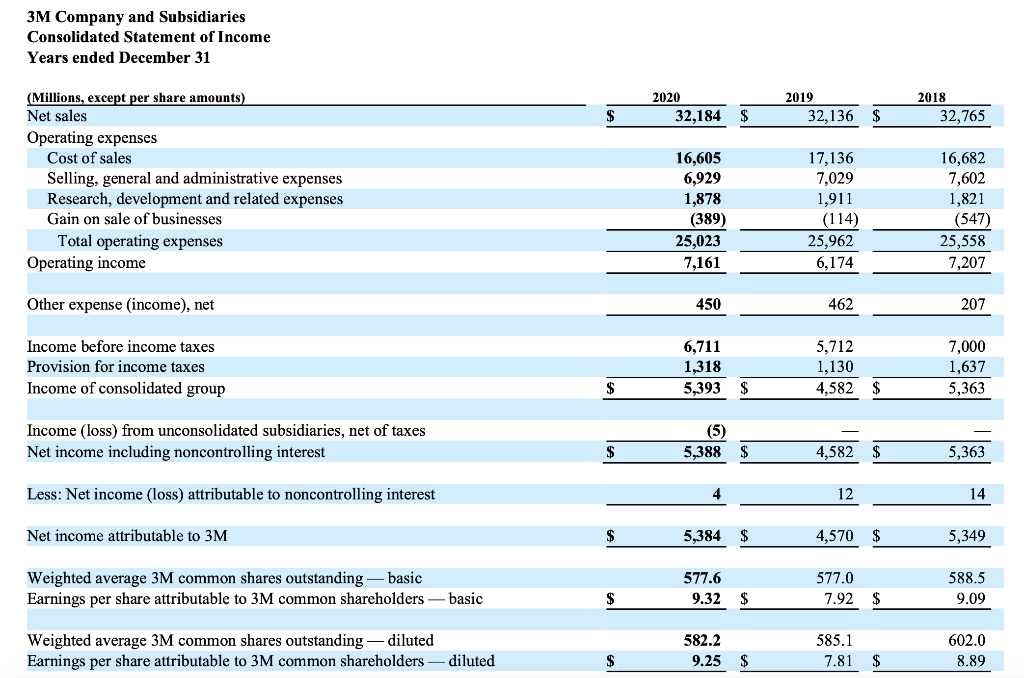
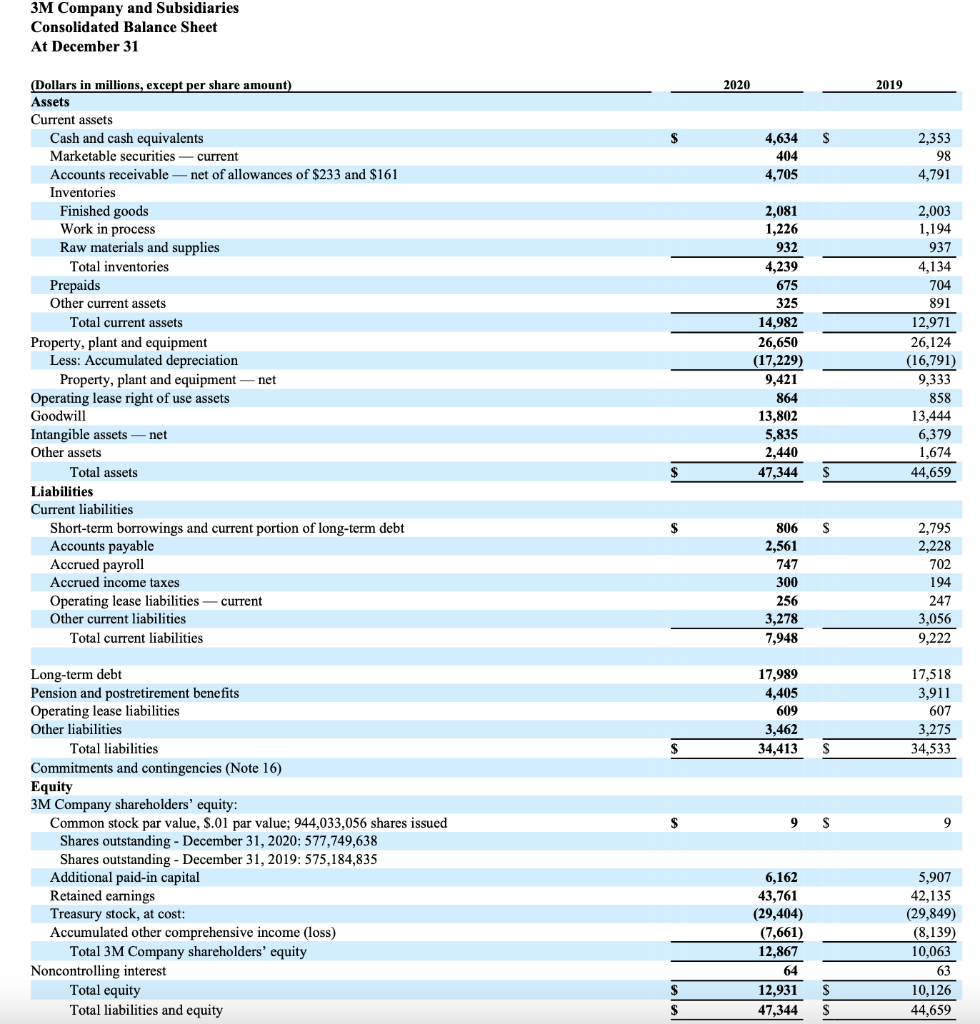
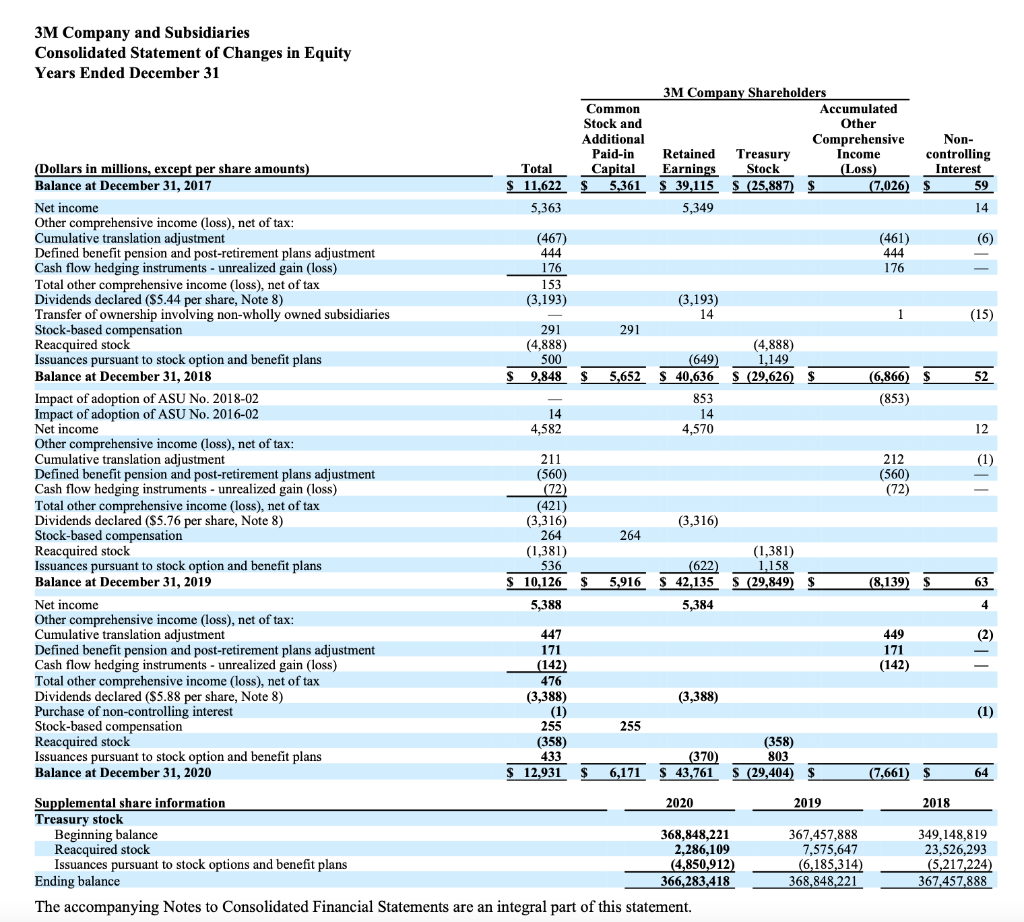
3M Company and Subsidiaries Consolidated Statement of Income Years ended December 31 2020 2019 32, 136 $ 2018 32,765 32,184 (Millions, except per share amounts) Net sales Operating expenses Cost of sales Selling, general and administrative expenses Research, development and related expenses Gain on sale of businesses Total operating expenses Operating income 16,605 6,929 1,878 (389) 25,023 7,161 17,136 7,029 1,911 (114) 25,962 6,174 16,682 7,602 1,821 (547) 25,558 7,207 Other expense (income), net 450 462 207 Income before income taxes Provision for income taxes Income of consolidated group 6,711 1,318 5,393 5,712 1,130 4,582 $ 7,000 1,637 5,363 $ $ Income (loss) from unconsolidated subsidiaries, net of taxes Net income including noncontrolling interest (5) 5,388 $ 4,582 $ 5,363 Less: Net income (loss) attributable to noncontrolling interest 12 14 Net income attributable to 3M $ 5,384 $ 4,570 $ 5,349 Weighted average 3M common shares outstanding basic Earnings per share attributable to 3M common shareholders 577.6 9.32 $ 577.0 7.92 $ 588.5 9.09 basic S 585.1 Weighted average 3M common shares outstanding - diluted Earnings per share attributable to 3M common shareholders diluted 582.2 9.25 602.0 8.89 $ 7.81 $ 3M Company and Subsidiaries Consolidated Balance Sheet At December 31 2020 2019 S 4,634 404 4,705 2,353 98 4,791 (Dollars in millions, except per share amount) Assets Current assets Cash and cash equivalents Marketable securities - current Accounts receivable - net of allowances of $233 and $161 Inventories Finished goods Work in process Raw materials and supplies Total inventories Prepaids Other current assets Total current assets Property, plant and equipment Less: Accumulated depreciation Property, plant and equipment net Operating lease right of use assets Goodwill Intangible assets net Other assets Total assets Liabilities Current liabilities Short-term borrowings and current portion of long-term debt Accounts payable Accrued payroll Accrued income taxes Operating lease liabilities current Other current liabilities Total current liabilities 2,081 1,226 932 4,239 675 325 14,982 26,650 (17,229) 9,421 864 13,802 5,835 2,440 47,344 2,003 1,194 937 4,134 704 891 12,971 26,124 (16,791) 9,333 858 13,444 6,379 1,674 44,659 S 806 2,561 747 300 256 3,278 7,948 2,795 2,228 702 194 247 3,056 9,222 17,989 4,405 609 3,462 34,413 17,518 3,911 607 3,275 34,533 $ 9 S 9 Long-term debt Pension and postretirement benefits Operating lease liabilities Other liabilities Total liabilities Commitments and contingencies (Note 16) Equity 3M Company shareholders' equity: Common stock par value, $.01 par value; 944,033,056 shares issued Shares outstanding - December 31, 2020: 577,749,638 Shares outstanding - December 31, 2019: 575,184,835 Additional paid-in capital Retained earnings Treasury stock, at cost: Accumulated other comprehensive income (loss) Total 3M Company shareholders' equity Noncontrolling interest Total equity Total liabilities and equity 6,162 43,761 (29,404) (7,661) 12,867 64 12,931 47,344 5,907 42,135 (29,849) (8,139) 10,063 63 10,126 44,659 $ S (7,026) 3M Company and Subsidiaries Consolidated Statement of Changes in Equity Years Ended December 31 3M Company Shareholders Common Accumulated Stock and Other Additional Comprehensive Non- Paid in Retained Treasury Income controlling (Dollars in millions, except per share amounts) Total Capital Earnings Stock (Loss) Interest Balance at December 31, 2017 $ 11,622 5,361 $ 39,115S (25,887) 59 Net income 5,363 5,349 14 Other comprehensive income (loss), net of tax: Cumulative translation adjustment (467) (461) (6) Defined benefit pension and post-retirement plans adjustment 444 444 Cash flow hedging instruments - unrealized gain (loss) 176 176 Total other comprehensive income (loss), net of tax 153 Dividends declared ($5.44 per share, Note 8) (3,193) (3,193) Transfer of ownership involving non-wholly owned subsidiaries 14 1 (15) Stock-based compensation 291 291 Reacquired stock (4,888 (4,888) Issuances pursuant to stock option and benefit plans 500 (649) 1,149 Balance at December 31, 2018 9,848 5,652 $ 40,636 S (29,626 (6,866) 52 Impact of adoption of ASU No. 2018-02 853 (853) Impact of adoption of ASU No. 2016-02 14 14 Net income 4,582 4,570 12 Other comprehensive income (loss), net of tax: Cumulative translation adjustment 211 212 (1) Defined benefit pension and post-retirement plans adjustment (560) (560) Cash flow hedging instruments - unrealized gain (loss) (72) (72) Total other comprehensive income (loss), net of tax (421) Dividends declared ($5.76 per share, Note 8) (3,316) (3,316) Stock-based compensation 264 264 Reacquired stock (1,381) (1,381) Issuances pursuant to stock option and benefit plans 536 (622) 1,158 Balance at December 31, 2019 $ 10.126 5,916 S42,135 S (29,849) (8,139) 63 Net income 5,384 Other comprehensive income (loss), net of tax: Cumulative translation adjustment 447 449 (2) Defined benefit pension and post-retirement plans adjustment 171 171 Cash flow hedging instruments - unrealized gain (loss) (142) (142) Total other comprehensive income (loss), net of tax 476 Dividends declared ($5.88 per share, Note 8) (3,388) (3,388) Purchase of non-controlling interest (1) (1) Stock-based compensation 255 255 Reacquired stock (358) (358) Issuances pursuant to stock option and benefit plans 433 (370) 803 Balance at December 31, 2020 $ 12,931 6,171 43,761 $ (29,404) (7,661) 64 Supplemental share information 2020 2019 2018 Treasury stock Beginning balance 368,848,221 367,457,888 349, 148,819 Reacquired stock 2,286,109 7,575,647 23,526,293 Issuances pursuant to stock options and benefit plans (4,850,912) (6,185,314) (5,217,224) Ending balance 366,283,418 368,848,221 367,457,888 The accompanying Notes to Consolidated Financial Statements are an integral part of this statement. 33 34 353 993 99 518 15 35389 $ 5,916 5,388 3M Company and Subsidiaries Consolidated Statement of Cash Flows Years ended December 31 2020 2019 2018 S 5,388 $ 4,582 $ 5,363 (Millions) Cash Flows from Operating Activities Net income including noncontrolling interest Adjustments to reconcile net income including noncontrolling interest to net cash provided by operating activities Depreciation and amortization Company pension and postretirement contributions Company pension and postretirement expense Stock-based compensation expense Gain on sale of businesses Deferred income taxes Loss on deconsolidation of Venezuelan subsidiary Changes in assets and liabilities Accounts receivable Inventories Accounts payable Accrued income taxes (current and long-term) Othernet Net cash provided by (used in) operating activities 1,911 (156) 406 262 (389) (165) 1,593 (210) 357 278 (111) (273) 162 1,488 (370) 410 302 (545) (57) 165 (91) 252 132 398 8,113 345 370 (117) 205 (111) 7,070 (305) (509) 408 134 120 6,439 (1,699) 123 Cash Flows from Investing Activities Purchases of property, plant and equipment (PP&E) Proceeds from sale of PP&E and other assets Acquisitions, net of cash acquired Purchases of marketable securities and investments Proceeds from maturities and sale of marketable securities and investments Proceeds from sale of businesses, net of cash sold Other net Net cash provided by (used in) investing activities (1,501) 128 (25) (1,579) 1,811 576 10 (580) (4,984) (1,635) 1,443 236 72 (6,444) (1,577) 262 13 (1,828) 2,497 846 9 222 Cash Flows from Financing Activities Change in short-term debt - net Repayment of debt (maturities greater than 90 days) Proceeds from debt (maturities greater than 90 days) Purchases of treasury stock Proceeds from issuance of treasury stock pursuant to stock option and benefit plans Dividends paid to shareholders Other net Net cash provided by (used in) financing activities (143) (3,482) 1,750 (368) 429 (3,388) (98) (5,300) (316) (2,716) 6,281 (1,407) 547 (3,316) (197) (1,124) (284) (1,034) 2,251 (4,870) 485 (3,193) (56) (6,701) Effect of exchange rate changes on cash and cash equivalents 48 (2) (160) Net increase (decrease) in cash and cash equivalents Cash and cash equivalents at beginning of year Cash and cash equivalents at end of period 2,281 2,353 4,634 (500) 2,853 2,353 (200) 3,053 2,853 S $