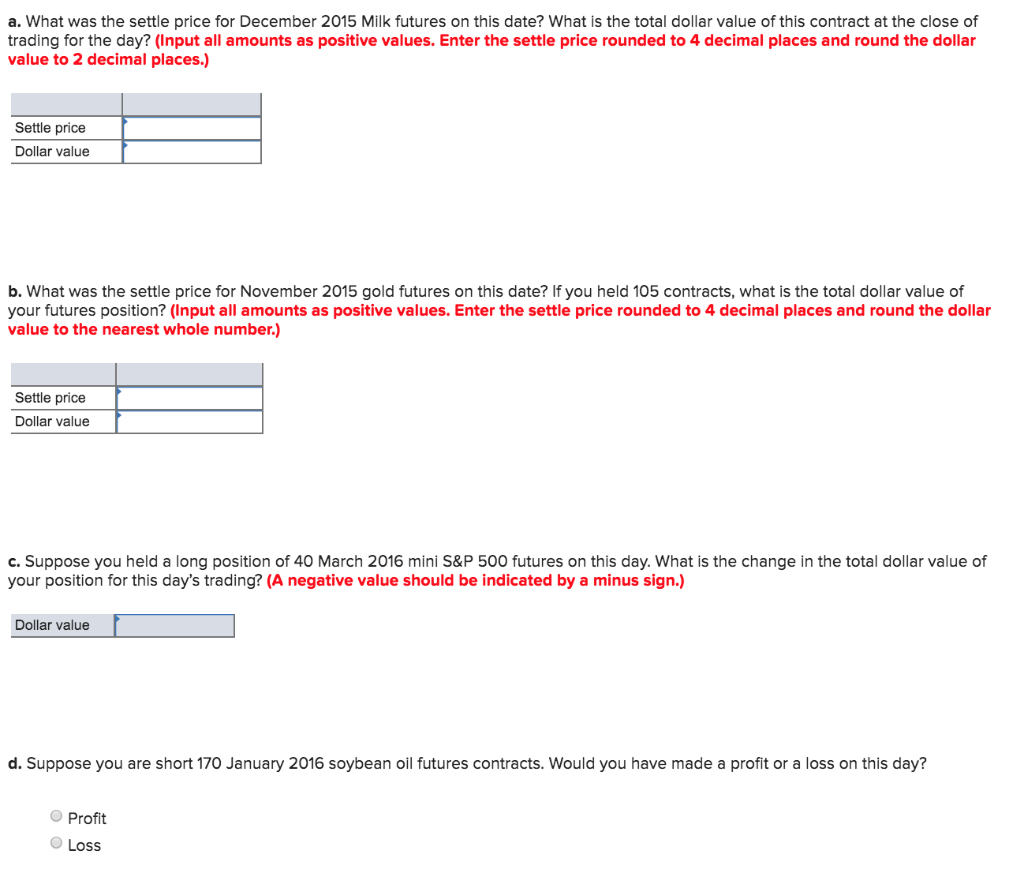
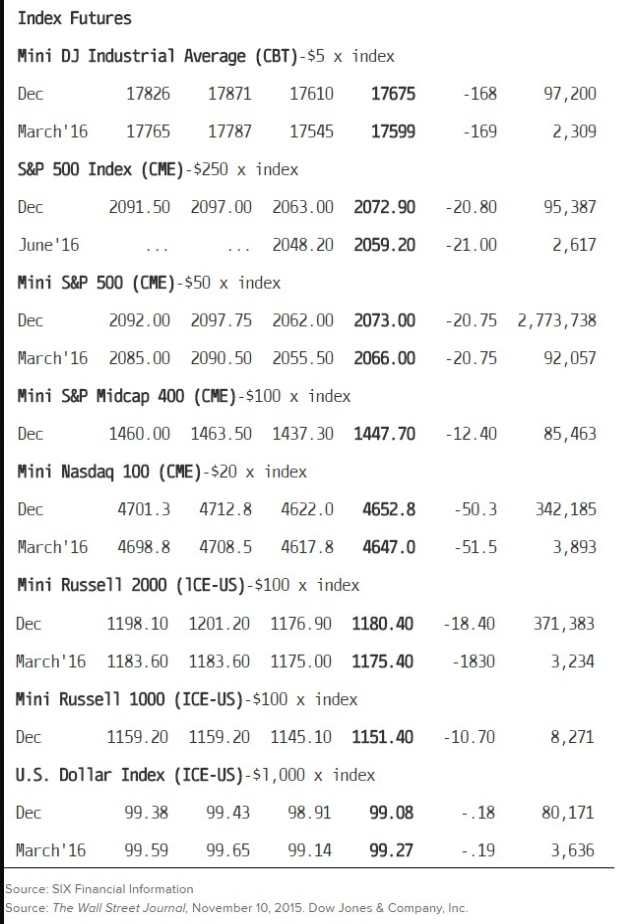
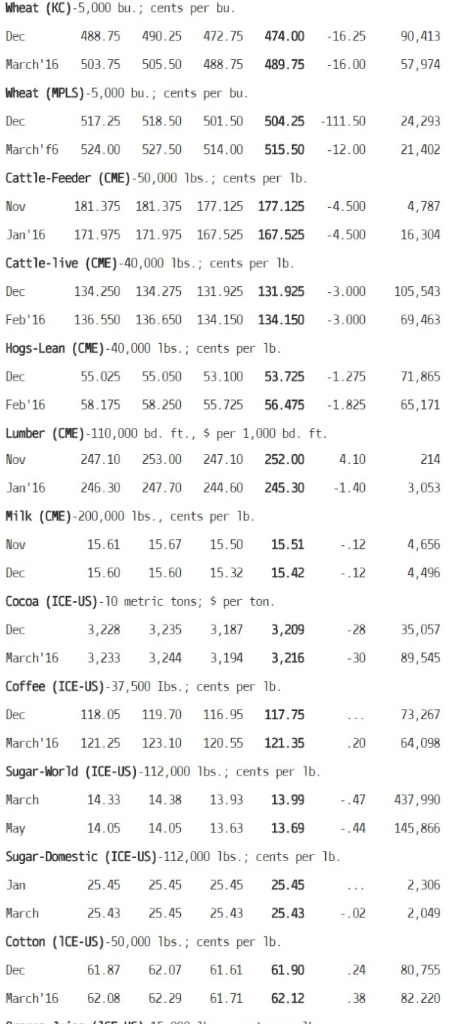
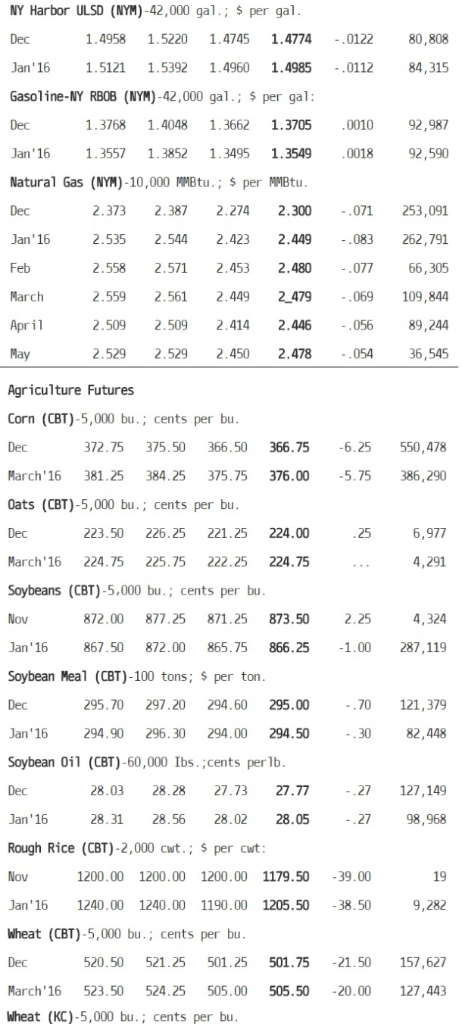
a. What was the settle price for December 2015 Milk futures on this date? What is the total dollar value of this contract at the close of trading for the day? (Input all amounts as positive values. Enter the settle price rounded to 4 decimal places and round the dollar value to 2 decimal places.) Settle price Dollar value b. What was the settle price for November 2015 gold futures on this date? If you held 105 contracts, what is the total dollar value of your futures position? (Input all amounts as positive values. Enter the settle price rounded to 4 decimal places and round the dollar value to the nearest whole number.) Settle price Dollar value c.Suppose you held a long position of 40 March 2016 mini S&P 500 futures on this day. What is the change in the total dollar value of your position for this day's trading? (A negative value should be indicated by a minus sign.) Dollar value d. Suppose you are short 170 January 2016 soybean oil futures contracts. Would you have made a profit or a loss on this day? Profit Loss Index Futures Mini DJ Industrial Average (CBT)-$5 x index Dec March'16 17765 17787 17545 17599 S&P 500 Index (CME)-$250 x index Dec June'16 Mini S&P 500 (CME)-$50 x index Dec March'16 2085.00 2090.50 2055.50 2066.00 20.75 Mini S&P Midcap 400 (CME)-$100 x index Dec Mini Nasdaq 100 (CME)-$20 x index Dec March'16 4698.8 4708.5 4617.8 4647.0 51.5 Mini Russel1 2000 (1CE-US)-$100 x index Dec March'16 1183.60 1183.60 1175.00 1175.401830 Mini Russel1 1000 (ICE-US)-$100 x index Dec U.S. Dollar Index (ICE-US)-$1,000 x index Dec March'16 99.59 99.65 99.14 99.27 97,200 17826 17871 17610 17675 -168 2,309 -169 95,387 2091.50 2097.00 2063.00 2072.90 -20.80 2,617 .. 2048. 20 2059.20 21.00 2092.00 2097.75 2062.00 2073.00 -20.75 2,773,738 92,057 1460.00 1463.50 1437.30 1447.70 12.40 85,463 4701.3 4712.8 4622.0 4652.8 50.3 342,185 3,893 1198.101201.20 1176.90 1180.4018.40 371,383 3,234 1159.20 1159.20 1145.10 1151.40 10.70 8,271 80,171 3,636 99.38 99.43 98.91 99.08 -.18 -.19 Source: SIX Financial Information Source: The Wall Street Journal, November 10, 2015. Dow Jones & Company, Inc. heat (KC)-5,000 bu.; cents per bu 90,413 488.75 490.25 472.75 474.00 16.25 57,974 March'16 503.75 505.50 488.75 489.7516.00 Wheat (MPLS)-5,000 bu.; cents per bu 17.25 518.50 501.50 504.25 -111.50 24,293 March' f6 524.00 527.50 514.00 515.50 12.00 21,402 Cattle-Feeder (CME)-50,000 lbs.; cents per lb 181.375 181.375 177.125 177.125 4.500 4,787 OV Jan'16 171.975 171.975 167.525 167.5254.500 Cattle-live (CME)-40,000 lbs.; cents per lb Dec Feb'16 136.550 136.650 134.150 134.150 3.000 Hogs-Lean (CME)-40,000 lbs.; cents per lb 16,304 134.250 134.275 131.925 131.925 3.000 105,543 69,463 55.025 55.050 53.100 53.725 -1.275 71,865 Feb'16 58.175 58.250 55.725 56.475 1.825 65,171 Lumber (CME)-110,000 bd. ft., $ per 1,000 bd. ft 214 247.10 253.00 247.10 252.00 4.10 OV Jan'16 Milk (CME)-200,000 lbs., cents per lb Nov 46.30 247.70 244.60 245.30 1.40 3,053 4,656 15.61 15.67 15.50 15.51 12 4,496 15.60 15.60 15.32 15.42 12 Cocoa (ICE-US)-10 metric tons; s per ton Dec March'16 3,233 3,244 3,194 3,216 Coffee (ICE-US)-37,500 Ibs.; cents per lb Dec March'16 121.25 123.10 120.55 121.35 Sugar-World (ICE-US)-112,000 lbs.; cents per 1t March 3,228 3,235 3,187 3,209 35,057 30 89,545 118.05 119.70 116.95 117.75 73,267 64,098 20 14.33 14.38 13.93 13.99 47 437,990 4 145,866 14.05 14.05 13.63 13.69 Sugar-Domestic (ICE-US)-112,000 lbs.; cents per lb 25.45 25.45 25.45 25.45 2,306 March 25.43 25.45 25.43 25.43 02 2,049 Cotton (1CE-US)-50,000 bs.; cents per lb 24 80,755 61.87 62.07 61.61 61.90 March'16 62.08 62.29 61.71 62.12 38 82.220 NY Harbor ULSD (NYM)-42,000 gal.; s per gal Dec Jan'16 Gasoline-NY RBOB (NYM)-42,000 gal. per gal 1.4958 1.5220 1.4745 1.4774.0122 80,808 84,315 1.5121 1.5392 1.4960 1.4985 -.0112 1.3768 1.4048 1.3662 1.3705 0010 92,987 Jan' 16 1.3557 1.3852 1.3495 1.3549 0018 92,590 Natural Gas (NYM)-10,000 MMBtu.; $ per MBtu Dec Jan'16 Feb March April 2.3732.387 2.274 2.300 .071 253,091 2.535 2.544 2.423 2.449 2.558 2.571 2.453 2.480 2.559 2.561 2.449 2 479.069 109,844 2.509 2.509 2.414 2.446.056 2.529 2.529 2.450 2.478 083 262,791 077 66,305 054 36,545 Agriculture Futures Corn (CBT)-5,000 bu.; cents per bu 372.75375.50 366.50 366.75 6.25 550,478 March'16 381.25 384.25 375.75 376.00 5.75 386,290 Oats (CBT)-5,000 bu.; cents per bu Dec March'16 224.75 225.75 222.25 224.75 Soybeans (CBT)-5,000 bu.; cents per bu 6,977 4,291 223.50 226.25 221.25 224.00 25 872.00 877.25 871.25 873.50 2.25 4,324 Jan '16 867.50 872.00 865.75 866.251.00 287,119 Soybean Meal (CBT)-100 tons; s per ton 295.70 297.20 294.60 295.00 70 121,379 Jan'16 294.90 296.30 294.00 294.50 Soybean 0i1 (CBT)-60,000 Ibs.;cents perlb Dec Jan'16 Rough Rice (CBT)-2,000 cwt.; $ per cwt 30 82,448 27 127,149 28.03 28.28 27.73 27.77 28.31 28.56 28.02 28.05 27 98,968 1200.00 1200.00 1200.00 1179.50-39.00 19 Jan'16 1240.00 1240.00 1190.00 1205.50 -38.50 Wheat (CBT)-5,000 bu.; cents per bu Dec March'16 523.50 524.25 505.00 505.50 20.00 127,443 heat (KC)-5,000 bu.; cents per bu 9,282 520.50521.25 501.25 501.75 21.50 157,627 a. What was the settle price for December 2015 Milk futures on this date? What is the total dollar value of this contract at the close of trading for the day? (Input all amounts as positive values. Enter the settle price rounded to 4 decimal places and round the dollar value to 2 decimal places.) Settle price Dollar value b. What was the settle price for November 2015 gold futures on this date? If you held 105 contracts, what is the total dollar value of your futures position? (Input all amounts as positive values. Enter the settle price rounded to 4 decimal places and round the dollar value to the nearest whole number.) Settle price Dollar value c.Suppose you held a long position of 40 March 2016 mini S&P 500 futures on this day. What is the change in the total dollar value of your position for this day's trading? (A negative value should be indicated by a minus sign.) Dollar value d. Suppose you are short 170 January 2016 soybean oil futures contracts. Would you have made a profit or a loss on this day? Profit Loss Index Futures Mini DJ Industrial Average (CBT)-$5 x index Dec March'16 17765 17787 17545 17599 S&P 500 Index (CME)-$250 x index Dec June'16 Mini S&P 500 (CME)-$50 x index Dec March'16 2085.00 2090.50 2055.50 2066.00 20.75 Mini S&P Midcap 400 (CME)-$100 x index Dec Mini Nasdaq 100 (CME)-$20 x index Dec March'16 4698.8 4708.5 4617.8 4647.0 51.5 Mini Russel1 2000 (1CE-US)-$100 x index Dec March'16 1183.60 1183.60 1175.00 1175.401830 Mini Russel1 1000 (ICE-US)-$100 x index Dec U.S. Dollar Index (ICE-US)-$1,000 x index Dec March'16 99.59 99.65 99.14 99.27 97,200 17826 17871 17610 17675 -168 2,309 -169 95,387 2091.50 2097.00 2063.00 2072.90 -20.80 2,617 .. 2048. 20 2059.20 21.00 2092.00 2097.75 2062.00 2073.00 -20.75 2,773,738 92,057 1460.00 1463.50 1437.30 1447.70 12.40 85,463 4701.3 4712.8 4622.0 4652.8 50.3 342,185 3,893 1198.101201.20 1176.90 1180.4018.40 371,383 3,234 1159.20 1159.20 1145.10 1151.40 10.70 8,271 80,171 3,636 99.38 99.43 98.91 99.08 -.18 -.19 Source: SIX Financial Information Source: The Wall Street Journal, November 10, 2015. Dow Jones & Company, Inc. heat (KC)-5,000 bu.; cents per bu 90,413 488.75 490.25 472.75 474.00 16.25 57,974 March'16 503.75 505.50 488.75 489.7516.00 Wheat (MPLS)-5,000 bu.; cents per bu 17.25 518.50 501.50 504.25 -111.50 24,293 March' f6 524.00 527.50 514.00 515.50 12.00 21,402 Cattle-Feeder (CME)-50,000 lbs.; cents per lb 181.375 181.375 177.125 177.125 4.500 4,787 OV Jan'16 171.975 171.975 167.525 167.5254.500 Cattle-live (CME)-40,000 lbs.; cents per lb Dec Feb'16 136.550 136.650 134.150 134.150 3.000 Hogs-Lean (CME)-40,000 lbs.; cents per lb 16,304 134.250 134.275 131.925 131.925 3.000 105,543 69,463 55.025 55.050 53.100 53.725 -1.275 71,865 Feb'16 58.175 58.250 55.725 56.475 1.825 65,171 Lumber (CME)-110,000 bd. ft., $ per 1,000 bd. ft 214 247.10 253.00 247.10 252.00 4.10 OV Jan'16 Milk (CME)-200,000 lbs., cents per lb Nov 46.30 247.70 244.60 245.30 1.40 3,053 4,656 15.61 15.67 15.50 15.51 12 4,496 15.60 15.60 15.32 15.42 12 Cocoa (ICE-US)-10 metric tons; s per ton Dec March'16 3,233 3,244 3,194 3,216 Coffee (ICE-US)-37,500 Ibs.; cents per lb Dec March'16 121.25 123.10 120.55 121.35 Sugar-World (ICE-US)-112,000 lbs.; cents per 1t March 3,228 3,235 3,187 3,209 35,057 30 89,545 118.05 119.70 116.95 117.75 73,267 64,098 20 14.33 14.38 13.93 13.99 47 437,990 4 145,866 14.05 14.05 13.63 13.69 Sugar-Domestic (ICE-US)-112,000 lbs.; cents per lb 25.45 25.45 25.45 25.45 2,306 March 25.43 25.45 25.43 25.43 02 2,049 Cotton (1CE-US)-50,000 bs.; cents per lb 24 80,755 61.87 62.07 61.61 61.90 March'16 62.08 62.29 61.71 62.12 38 82.220 NY Harbor ULSD (NYM)-42,000 gal.; s per gal Dec Jan'16 Gasoline-NY RBOB (NYM)-42,000 gal. per gal 1.4958 1.5220 1.4745 1.4774.0122 80,808 84,315 1.5121 1.5392 1.4960 1.4985 -.0112 1.3768 1.4048 1.3662 1.3705 0010 92,987 Jan' 16 1.3557 1.3852 1.3495 1.3549 0018 92,590 Natural Gas (NYM)-10,000 MMBtu.; $ per MBtu Dec Jan'16 Feb March April 2.3732.387 2.274 2.300 .071 253,091 2.535 2.544 2.423 2.449 2.558 2.571 2.453 2.480 2.559 2.561 2.449 2 479.069 109,844 2.509 2.509 2.414 2.446.056 2.529 2.529 2.450 2.478 083 262,791 077 66,305 054 36,545 Agriculture Futures Corn (CBT)-5,000 bu.; cents per bu 372.75375.50 366.50 366.75 6.25 550,478 March'16 381.25 384.25 375.75 376.00 5.75 386,290 Oats (CBT)-5,000 bu.; cents per bu Dec March'16 224.75 225.75 222.25 224.75 Soybeans (CBT)-5,000 bu.; cents per bu 6,977 4,291 223.50 226.25 221.25 224.00 25 872.00 877.25 871.25 873.50 2.25 4,324 Jan '16 867.50 872.00 865.75 866.251.00 287,119 Soybean Meal (CBT)-100 tons; s per ton 295.70 297.20 294.60 295.00 70 121,379 Jan'16 294.90 296.30 294.00 294.50 Soybean 0i1 (CBT)-60,000 Ibs.;cents perlb Dec Jan'16 Rough Rice (CBT)-2,000 cwt.; $ per cwt 30 82,448 27 127,149 28.03 28.28 27.73 27.77 28.31 28.56 28.02 28.05 27 98,968 1200.00 1200.00 1200.00 1179.50-39.00 19 Jan'16 1240.00 1240.00 1190.00 1205.50 -38.50 Wheat (CBT)-5,000 bu.; cents per bu Dec March'16 523.50 524.25 505.00 505.50 20.00 127,443 heat (KC)-5,000 bu.; cents per bu 9,282 520.50521.25 501.25 501.75 21.50 157,627