Question
a. Which country has an absolute advantage in wine? In cheese? b. Which country has a comparative advantage in wine? In cheese? c. Graph each

a. Which country has an absolute advantage in wine? In cheese?
b. Which country has a comparative advantage in wine? In cheese?
c. Graph each country’s production-possibility curve. Show the no-trade production point for each country, assuming that with no trade Vintland consumes 1.5 million kilos of cheese and the Moonited Republic consumes 3 million kilos of cheese.
d. When trade is opened, which country exports which good? If the equilibrium international price ratio is 1/2 bottle of wine per kilo of cheese, what happens to production in each country?
e. In this free-trade equilibrium, 2 million kilos of cheese and 1 million bottles of wine are traded. What is the consumption point in each country with free trade? Show this graphically.
f. Does each country gain from trade? Explain, referring to your graph as is appropriate.
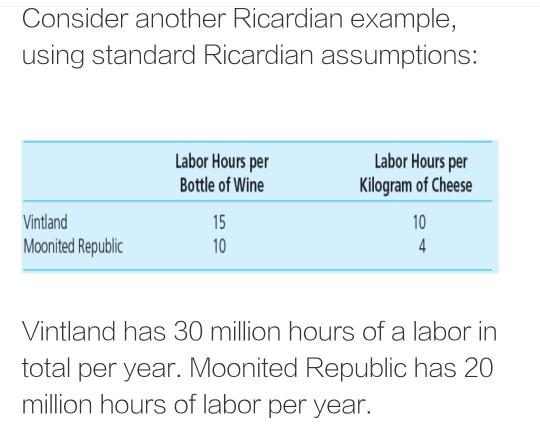
Consider another Ricardian example, using standard Ricardian assumptions: Labor Hours per Labor Hours per Kilogram of Cheese Bottle of Wine Vintland 15 10 Moonited Republic 10 4 Vintland has 30 million hours of a labor in total per year. Moonited Republic has 20 million hours of labor per year.
Step by Step Solution
3.53 Rating (174 Votes )
There are 3 Steps involved in it
Step: 1
Total Output can be found by dividing the total Labour Hours by Labour hour to produce one unit Vint...
Get Instant Access to Expert-Tailored Solutions
See step-by-step solutions with expert insights and AI powered tools for academic success
Step: 2

Step: 3

Ace Your Homework with AI
Get the answers you need in no time with our AI-driven, step-by-step assistance
Get Started


