

Answered step by step
Verified Expert Solution
Question
1 Approved Answer
A. Write a program that produces a plot of the Geometric Distribution as a function of the number of Bernoulli trials for the first success
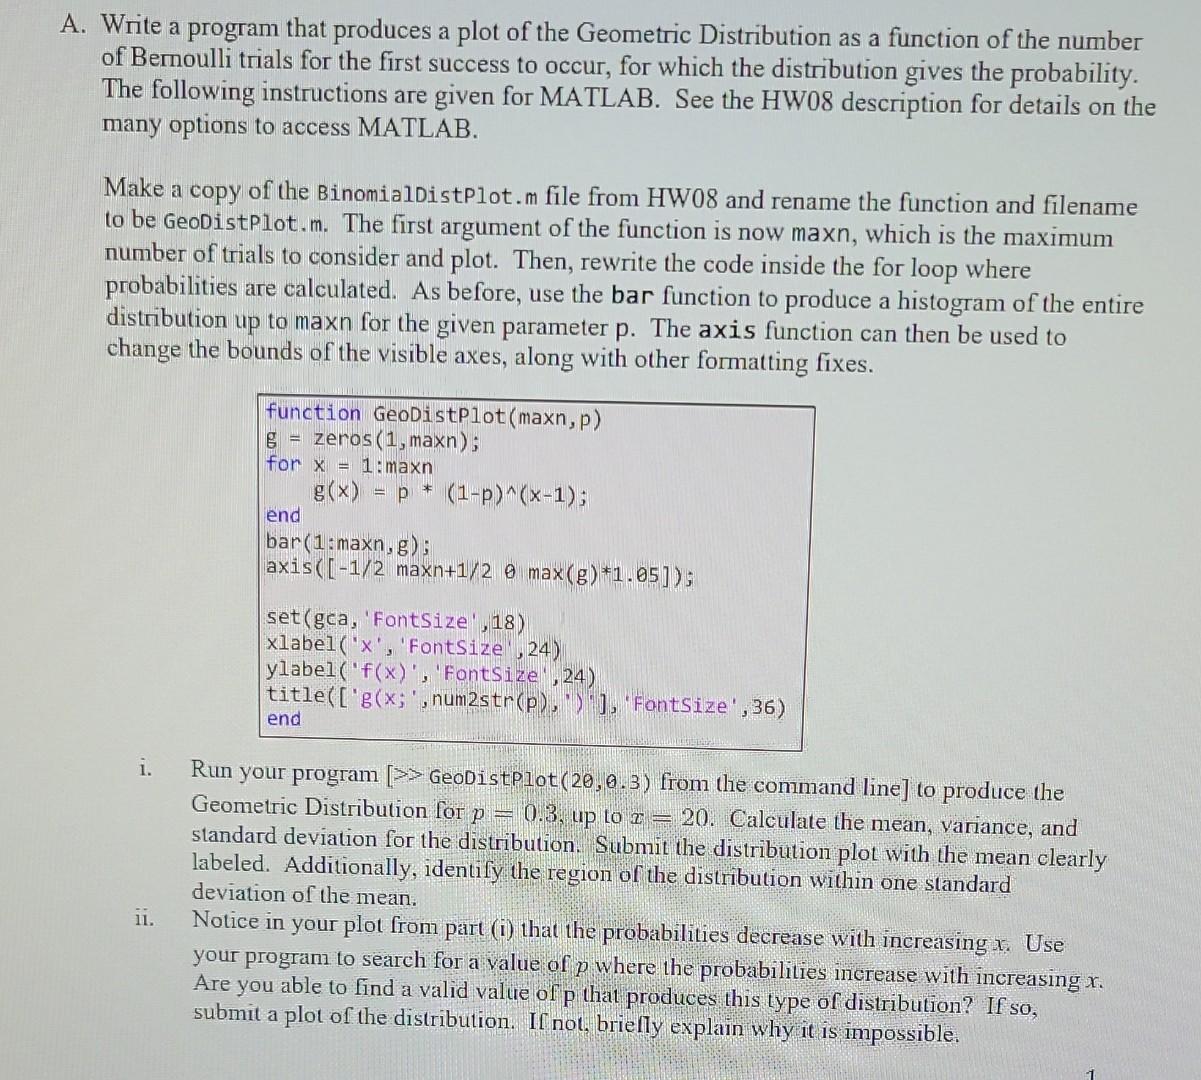
A. Write a program that produces a plot of the Geometric Distribution as a function of the number of Bernoulli trials for the first success to occur, for which the distribution gives the probability. The following instructions are given for MATLAB. See the HW08 description for details on the many options to access MATLAB. Make a copy of the BinomialdistPlot.m file from HW08 and rename the function and filename to be GeoDistPlot.m. The first argument of the function is now maxn, which is the maximum number of trials to consider and plot. Then, rewrite the code inside the for loop where probabilities are calculated. As before, use the bar function to produce a histogram of the entire distribution up to maxn for the given parameter p. The axis function can then be used to change the bounds of the visible axes, along with other formatting fixes. i. Run your program [ > GeoDistplot (20,0,3) from the command line] to produce the Geometric Distribution for p=0.3, up to x=20. Calculate the mean, variance, and standard deviation for the distribution. Submit the distribution plot with the mean clearly labeled. Additionally, identify the region of the distribution within one standard deviation of the mean. ii. Notice in your plot from part (i) that the probabilities decrease with increasing x. Use your program to search for a value of p where the probabilities increase with increasing x. Are you able to find a valid value of P that produces this type of distribution? If so, submit a plot of the distribution. If not, briefly explain why it is impossible. A. Write a program that produces a plot of the Geometric Distribution as a function of the number of Bernoulli trials for the first success to occur, for which the distribution gives the probability. The following instructions are given for MATLAB. See the HW08 description for details on the many options to access MATLAB. Make a copy of the BinomialdistPlot.m file from HW08 and rename the function and filename to be GeoDistPlot.m. The first argument of the function is now maxn, which is the maximum number of trials to consider and plot. Then, rewrite the code inside the for loop where probabilities are calculated. As before, use the bar function to produce a histogram of the entire distribution up to maxn for the given parameter p. The axis function can then be used to change the bounds of the visible axes, along with other formatting fixes. i. Run your program [ > GeoDistplot (20,0,3) from the command line] to produce the Geometric Distribution for p=0.3, up to x=20. Calculate the mean, variance, and standard deviation for the distribution. Submit the distribution plot with the mean clearly labeled. Additionally, identify the region of the distribution within one standard deviation of the mean. ii. Notice in your plot from part (i) that the probabilities decrease with increasing x. Use your program to search for a value of p where the probabilities increase with increasing x. Are you able to find a valid value of P that produces this type of distribution? If so, submit a plot of the distribution. If not, briefly explain why it is impossible
Step by Step Solution
There are 3 Steps involved in it
Step: 1

Get Instant Access to Expert-Tailored Solutions
See step-by-step solutions with expert insights and AI powered tools for academic success
Step: 2

Step: 3
Ace Your Homework with AI
Get the answers you need in no time with our AI-driven, step-by-step assistance
Get Started
The Payroll Audit
Authors: Robert Leach
1st Edition
0955970792, 978-0955970795