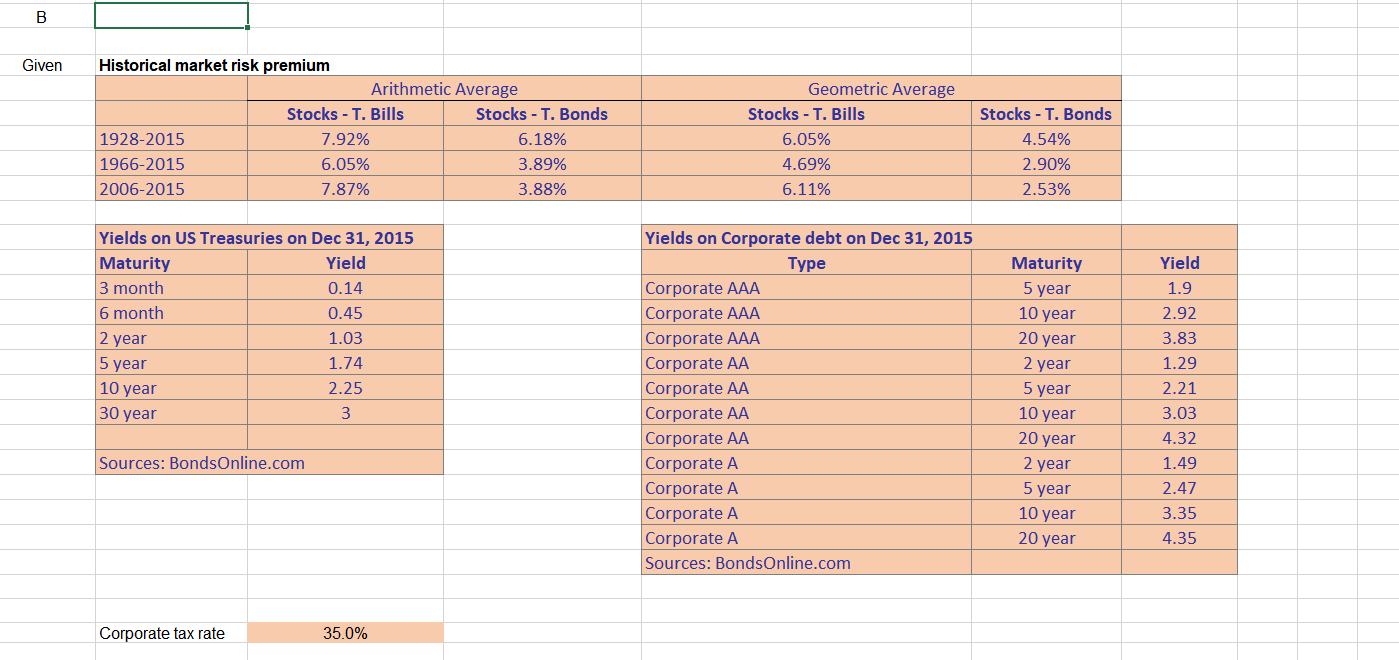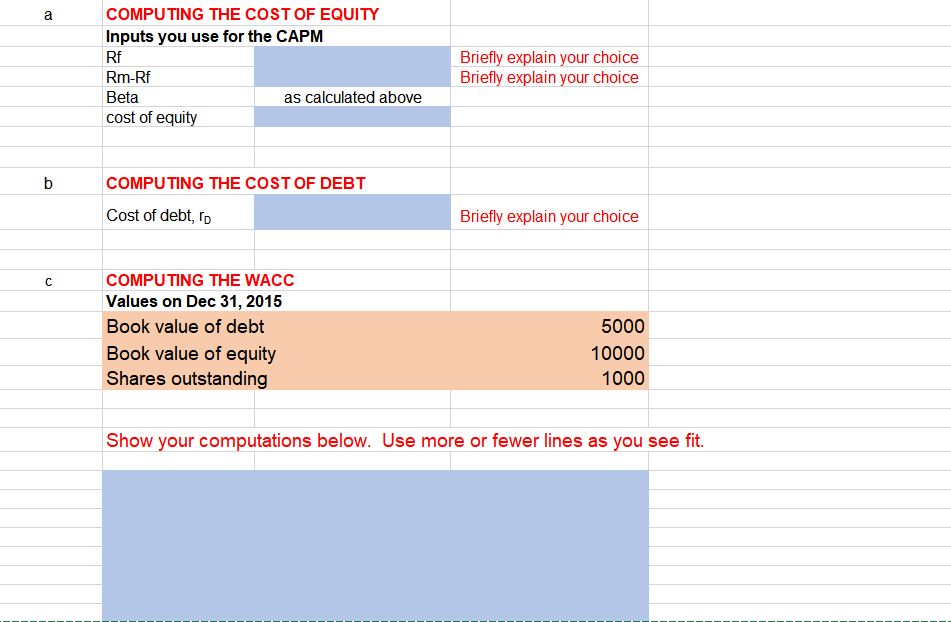


A Year 2008 2009 2007 2008 2009 2010 2011 2012 2013 2014 2015 Dec. 31 stock price (unadjusted for dividends) 31.50 29.19 33.88 40.75 32.88 34.75 30.75 41.50 40.63 53.50 54.25 HOPKINS USA, INC. Dec. 15 dividend per share 2.50 2.50 3.00 3.00 1.60 1.40 0.80 0.80 1.10 1.60 covar Beta Stock returns (adjusted for dividends) 2006 2007 2008 2009 2010 2011 2012 2013 2014 2015 S&P 500 return 5.0% 17.2% 32.0% -3.3% 25.0% 5.0% 10.0% 1.2% 28.0% 15.0% B Given Historical market risk premium Stocks - T. Bills 1928-2015 7.92% 1966-2015 6.05% 2006-2015 7.87% Yields on US Treasuries on Dec 31, 2015 Maturity Yield 3 month 0.14 6 month 0.45 2 year 1.03 5 year 1.74 10 year 2.25 30 year 3 Sources: BondsOnline.com Corporate tax rate 35.0% Arithmetic Average Stocks - T. Bonds 6.18% 3.89% 3.88% Geometric Average Stocks - T. Bills 6.05% 4.69% 6.11% Yields on Corporate debt on Dec 31, 2015 Type Corporate AAA Corporate AAA Corporate AAA Corporate AA Corporate AA Corporate AA Corporate AA Corporate A Corporate A Corporate A Corporate A Sources: BondsOnline.com Stocks - T. Bonds 4.54% 2.90% 2.53% Maturity 5 year 10 year 20 year 2 year 5 year 10 year 20 year 2 year 5 year 10 year 20 year Yield 1.9 2.92 3.83 1.29 2.21 3.03 4.32 1.49 2.47 3.35 4.35 a b COMPUTING THE COST OF EQUITY Inputs you use for the CAPM Rf Briefly explain your choice Briefly explain your choice Rm-Rf Beta cost of equity COMPUTING THE COST OF DEBT Cost of debt, rp Briefly explain your choice COMPUTING THE WACC Values on Dec 31, 2015 Book value of debt 5000 Book value of equity 10000 Shares outstanding 1000 Show your computations below. Use more or fewer lines as you see fit. as calculated above A Year 2008 2009 2007 2008 2009 2010 2011 2012 2013 2014 2015 Dec. 31 stock price (unadjusted for dividends) 31.50 29.19 33.88 40.75 32.88 34.75 30.75 41.50 40.63 53.50 54.25 HOPKINS USA, INC. Dec. 15 dividend per share 2.50 2.50 3.00 3.00 1.60 1.40 0.80 0.80 1.10 1.60 covar Beta Stock returns (adjusted for dividends) 2006 2007 2008 2009 2010 2011 2012 2013 2014 2015 S&P 500 return 5.0% 17.2% 32.0% -3.3% 25.0% 5.0% 10.0% 1.2% 28.0% 15.0% B Given Historical market risk premium Stocks - T. Bills 1928-2015 7.92% 1966-2015 6.05% 2006-2015 7.87% Yields on US Treasuries on Dec 31, 2015 Maturity Yield 3 month 0.14 6 month 0.45 2 year 1.03 5 year 1.74 10 year 2.25 30 year 3 Sources: BondsOnline.com Corporate tax rate 35.0% Arithmetic Average Stocks - T. Bonds 6.18% 3.89% 3.88% Geometric Average Stocks - T. Bills 6.05% 4.69% 6.11% Yields on Corporate debt on Dec 31, 2015 Type Corporate AAA Corporate AAA Corporate AAA Corporate AA Corporate AA Corporate AA Corporate AA Corporate A Corporate A Corporate A Corporate A Sources: BondsOnline.com Stocks - T. Bonds 4.54% 2.90% 2.53% Maturity 5 year 10 year 20 year 2 year 5 year 10 year 20 year 2 year 5 year 10 year 20 year Yield 1.9 2.92 3.83 1.29 2.21 3.03 4.32 1.49 2.47 3.35 4.35 a b COMPUTING THE COST OF EQUITY Inputs you use for the CAPM Rf Briefly explain your choice Briefly explain your choice Rm-Rf Beta cost of equity COMPUTING THE COST OF DEBT Cost of debt, rp Briefly explain your choice COMPUTING THE WACC Values on Dec 31, 2015 Book value of debt 5000 Book value of equity 10000 Shares outstanding 1000 Show your computations below. Use more or fewer lines as you see fit. as calculated above


