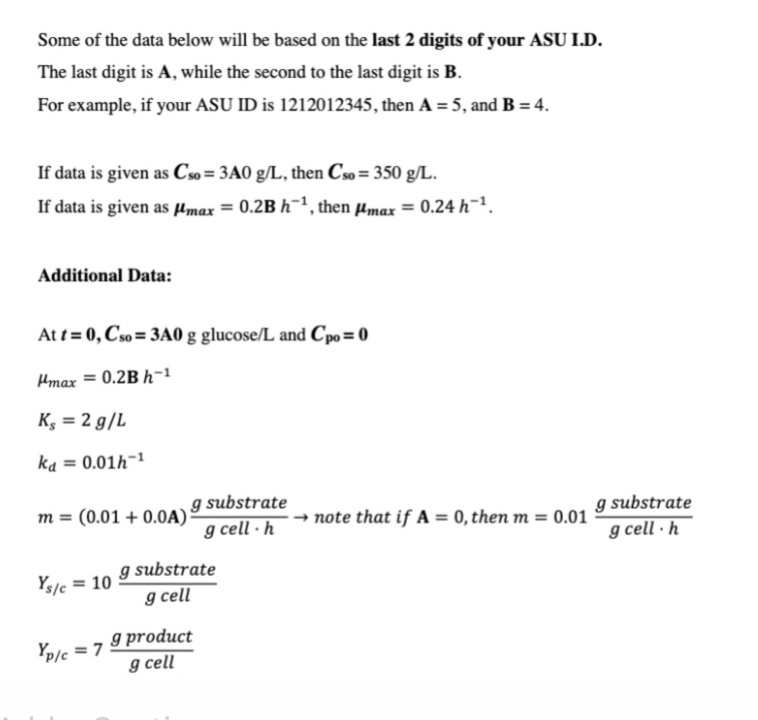
A=15B=18Some of the data below will be based on the last 2 digits of your ASU I.D.The last digit is A, while the second to the last digit is B.For example, if your ASU ID is 1212012345, then A = 5, and B = 4.If data is given as Co = 3A0 g/L, then Cso = 350 g/LIf data is given as Amar = 0.2B h-1, then Almar = 0.24 h1.Additional Data:At t= 0, Cso = 3A0 g glucose/L and Cpo = 0Amar = 0.2B h-1Kj=2g/Lka=0.01h-1? = (0.01 + 0.0A) gsubstrate/ g cell ? h* note that if A = 0, then m = 0.01 gsubstrate/g cell. hYs/c= 10 gsubstrate/g cellYo/e = 7 g product/g cell
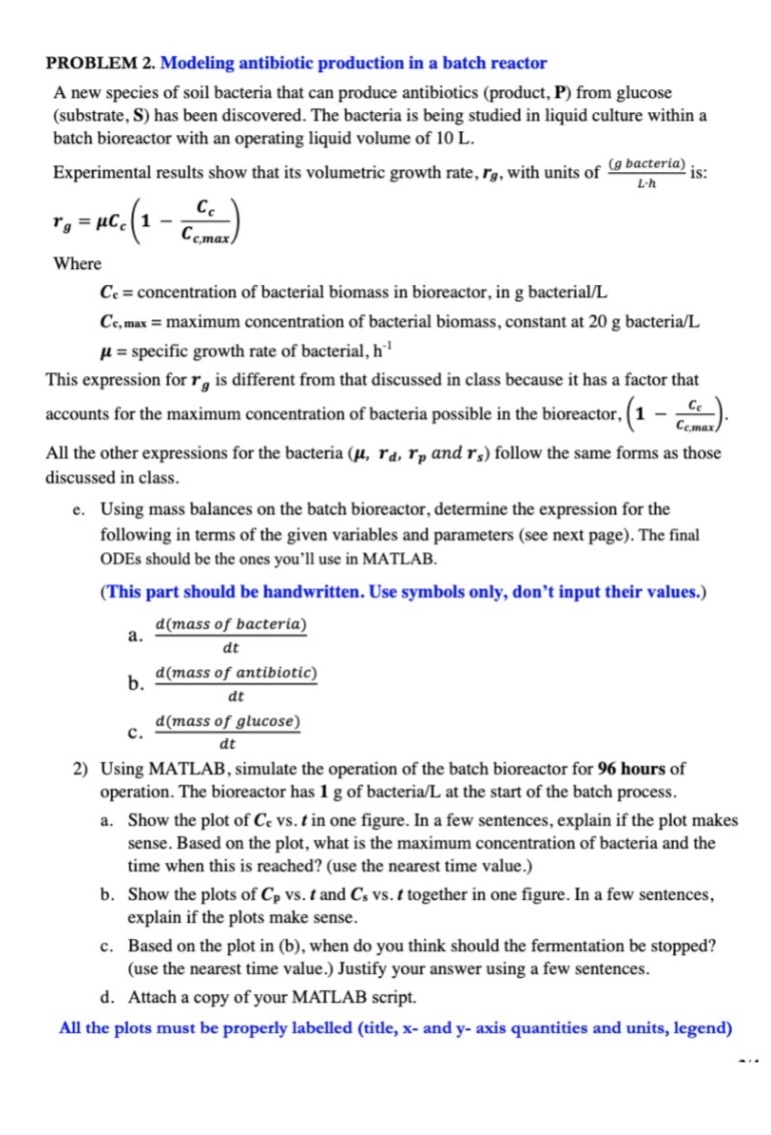
PROBLEM 2. Modeling antibiotic production in a batch reactor A new species of soil bacteria that can produce antibiotics (product, P) from glucose (substrate, S) has been discovered. The bacteria is being studied in liquid culture within a batch bioreactor with an operating liquid volume of 10 L. Experimental results show that its volumetric growth rate, Ig, with units of (9 bacteria) ; L.h r, = uCe (1 Cc Cc.max Where Ce = concentration of bacterial biomass in bioreactor, in g bacterial/L Ce, max = maximum concentration of bacterial biomass, constant at 20 g bacteria/L H = specific growth rate of bacterial, h" This expression for r, is different from that discussed in class because it has a factor that accounts for the maximum concentration of bacteria possible in the bioreactor, (1 - ) All the other expressions for the bacteria (#, "d, rp and Is) follow the same forms as those discussed in class. e. Using mass balances on the batch bioreactor, determine the expression for the following in terms of the given variables and parameters (see next page). The final ODEs should be the ones you'll use in MATLAB. (This part should be handwritten. Use symbols only, don't input their values.) a. d(mass of bacteria) dt b d(mass of antibiotic) dt C. d(mass of glucose) dt 2) Using MATLAB, simulate the operation of the batch bioreactor for 96 hours of operation. The bioreactor has 1 g of bacteria/L at the start of the batch process. a. Show the plot of Ce vs. t in one figure. In a few sentences, explain if the plot makes sense. Based on the plot, what is the maximum concentration of bacteria and the time when this is reached? (use the nearest time value.) b. Show the plots of Cp vs. t and Cs vs. t together in one figure. In a few sentences, explain if the plots make sense. c. Based on the plot in (b), when do you think should the fermentation be stopped? (use the nearest time value.) Justify your answer using a few sentences. d. Attach a copy of your MATLAB script. All the plots must be properly labelled (title, x- and y- axis quantities and units, legend)Some of the data below will be based on the last 2 digits of your ASU I.D. The last digit is A, while the second to the last digit is B. For example, if your ASU ID is 1212012345, then A = 5, and B = 4. If data is given as Cso = 3A0 g/L, then Cso = 350 g/L. If data is given as /max = 0.2B h-1, then Hmax = 0.24 h-1. Additional Data: At ( = 0, Cso = 340 g glucose/L and Cpo = 0 Hmax = 0.2B h-1 Ks = 2g/L ka = 0.01h-1 m = (0.01 + 0.0A) g substrate g cell . h - - note that if A = 0, then m = 0.01 9 substrate g cell . h Y's/c = 10 9 substrate g cell Yp/c = 7 9 product g cell


