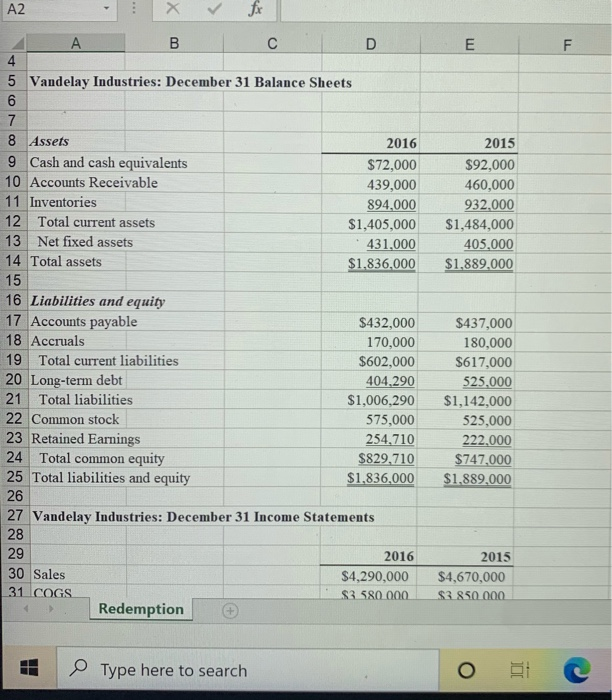
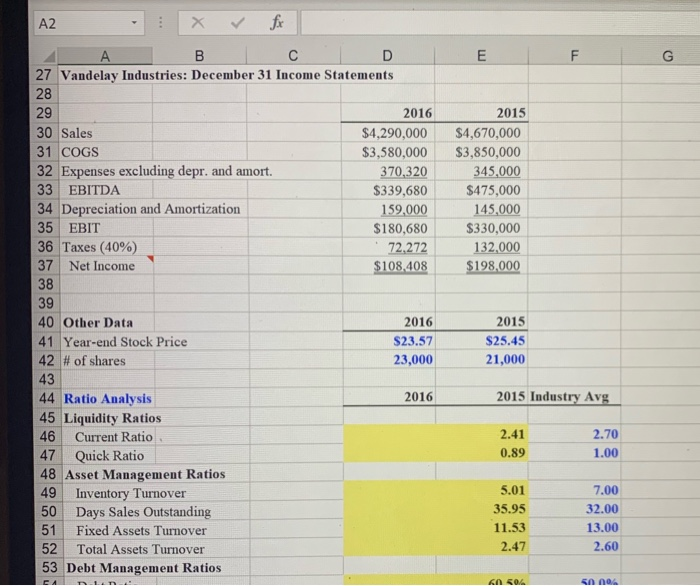
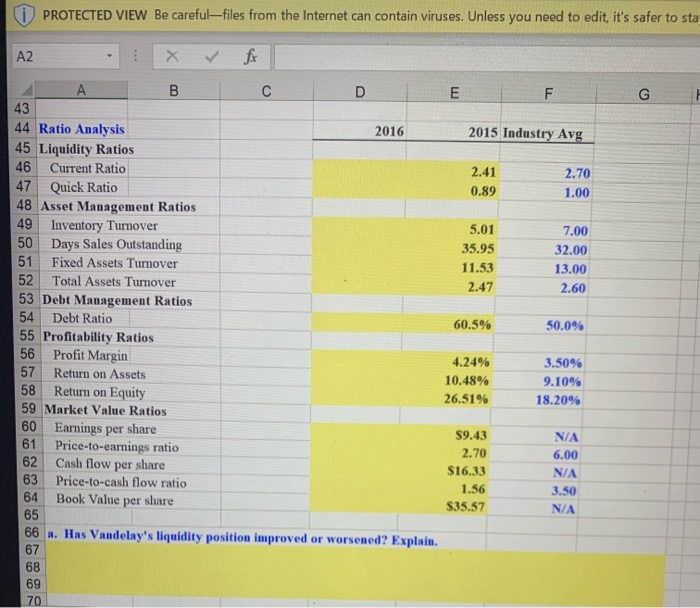
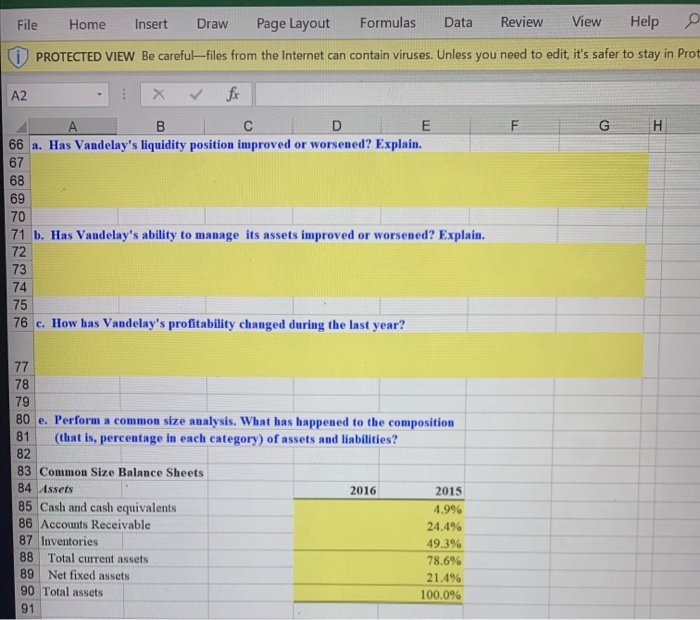
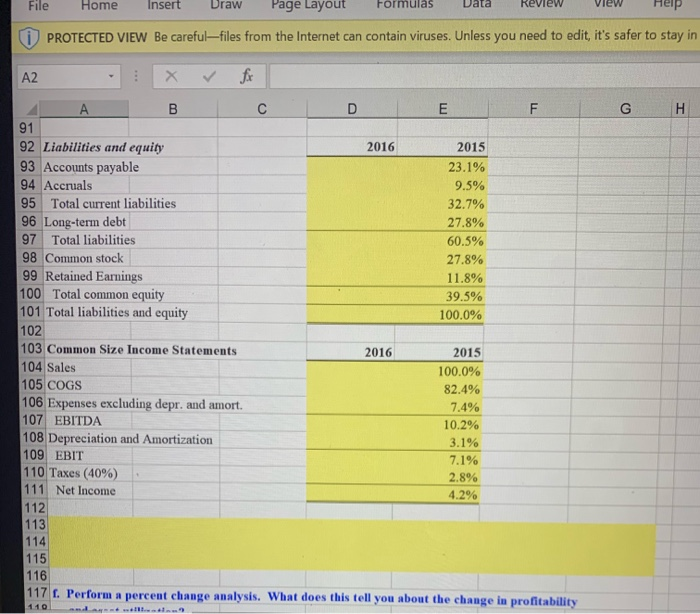
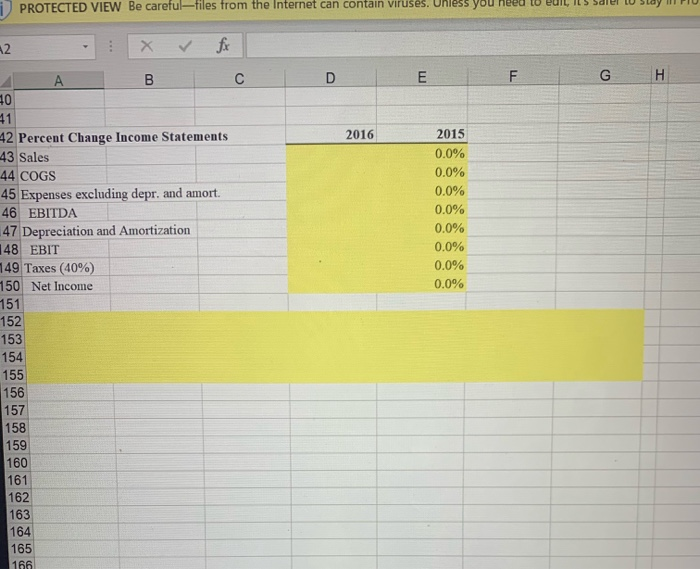
A2 A B C D E 1 4 5 Vandelay Industries: December 31 Balance Sheets 7 2015 $92,000 460,000 932.000 $1,484,000 405.000 $1.889.000 8 Assets 2016 9 Cash and cash equivalents $72,000 10 Accounts Receivable 439,000 11 Inventories 894.000 12 Total current assets $1,405,000 13 Net fixed assets 431.000 14 Total assets $1,836,000 15 16 Liabilities and equity 17 Accounts payable $432,000 18 Accruals 170,000 19 Total current liabilities $602,000 20 Long-term debt 404,290 21 Total liabilities $1,006,290 22 Common stock 575,000 23 Retained Earnings 254.710 24 Total common equity $829,710 25 Total liabilities and equity $1,836,000 26 27 Vandelay Industries: December 31 Income Statements $437,000 180,000 $617,000 525,000 $1,142,000 525,000 222,000 $747,000 $1.889,000 28 30 Sales 31 COGS 2016 $4,290,000 $3.580.000 2015 $4,670,000 $3.850.000 Redemption Type here to search AZ 2015 $4,670,000 $3,850,000 345,000 $475,000 145,000 $330,000 132,000 $198.000 27 Vandelay Industries: December 31 Income Statements 28 29 2016 30 Sales $4,290,000 31 COGS $3,580,000 32 Expenses excluding depr. and amort. 370,320 33 EBITDA $339,680 34 Depreciation and Amortization 159,000 35 EBIT $180,680 36 Taxes (40%) 72,272 37 Net Income $108,408 38 39 40 Other Data 2016 41 Year-end Stock Price $23.57 42 # of shares 23,000 43 44 Ratio Analysis 2016 45 Liquidity Ratios 46 Current Ratio 47 Quick Ratio 48 Asset Management Ratios 49 Inventory Turnover 50 Days Sales Outstanding 51 Fixed Assets Turnover 52 Total Assets Turnover 53 Debt Management Ratios 2015 $25.45 21,000 2015 Industry Avg 2.41 0.89 2.70 1.00 5.01 35.95 11.53 2.47 7.00 32.00 13.00 2.60 CA 60504 50 00 (i) PROTECTED VIEW Be careful--files from the Internet can contain viruses. Unless you need to edit, it's safer to sta A A B C D E F G 43 2016 2015 Industry Avg 2.41 0.89 2.70 1.00 5.01 35.95 11.53 2.47 7.00 32.00 13.00 2.60 44 Ratio Analysis 45 Liquidity Ratios 46 Current Ratio 47 Quick Ratio 48 Asset Management Ratios 49 Inventory Turnover 50 Days Sales Outstanding 51 Fixed Assets Turnover 52 Total Assets Turnover 53 Debt Management Ratios 54 Debt Ratio 55 Profitability Ratios 56 Profit Margin 57 Return on Assets 58 Return on Equity 59 Market Value Ratios 60 Earnings per share 61 Price-to-earnings ratio 62 Cash flow per share 63 Price-to-cash flow ratio 64 Book Value per share 60.5% 50.0% 4.24% 10.48% 26.51% 3.50% 9.109 18.20% NA 6.00 $9.43 2.70 $16.33 1.56 $35.57 a. Has Vandelay's liquidity position improved or worsened? Explain. File Home Insert Draw P age Layout Formulas Data Review View Help PROTECTED VIEW Be careful-files from the Internet can contain viruses. Unless you need to edit, it's safer to stay in Prot A2 I B C D E 66 a. Has Vandelay's liquidity position improved or worsened? Explain. F G H 71 b. Has Vandelay's ability to manage its assets improved or worsened? Explain. 76 c. How has Vandelay's profitability changed during the last year? 2016 80 e. Perform a common size analysis. What has happened to the composition 81 (that is, percentage in each category) of assets and liabilities? 82 83 Common Size Balance Sheets 84 Assets 2015 85 Cash and cash equivalents 4.9% 86 Accounts Receivable 24.4% 87 Inventories 49.3% 88 Total current assets 78.6% 89 Net fixed assets 21.4% 90 Total assets 100.0% File Home Insert Draw Page Layout Formulas Data Review View Help PROTECTED VIEW Be careful--files from the Internet can contain viruses. Unless you need to edit, it's safer to stay in AZ :x v fr | G H 2016 2015 23.1% 9.5% 32.7% 27.8% 60.5% 27.8% 11.8% 39.5% 100.0% 4 91 92 Liabilities and equity 93 Accounts payable 94 Accruals 95 Total current liabilities 96 Long-term debt 97 Total liabilities 98 Common stock 99 Retained Earnings 100 Total common equity 101 Total liabilities and equity 102 103 Common Size Income Statements 104 Sales 105 COGS 106 Expenses excluding depr. and amort. 107 EBITDA 108 Depreciation and Amortization 109 EBIT 110 Taxes (40%) 111 Net Income 112 113 114 115 2016 2015 100.0% 82.4% 7.4% 10.2% 3.1% 7.1% 2.8% 4.2% 116 117. Perform a percent change analysis. What does this tell you about the change in profitability 1) PROTECTED VIEW Be careful -tiles from the Internet can contain viruses. Unless you need to LUI, IL 5 Sale LU S A B C D A 40 G H 2016 42 Percent Change Income Statements 43 Sales 44 COGS 45 Expenses excluding depr, and amort. 46 EBITDA 47 Depreciation and Amortization 148 EBIT 149 Taxes (40%) 150 Net Income 151 152 2015 0.0% 0.0% 0.0% 0.0% 0.0% 0.0% 0.0% 0.0% 153 165 166