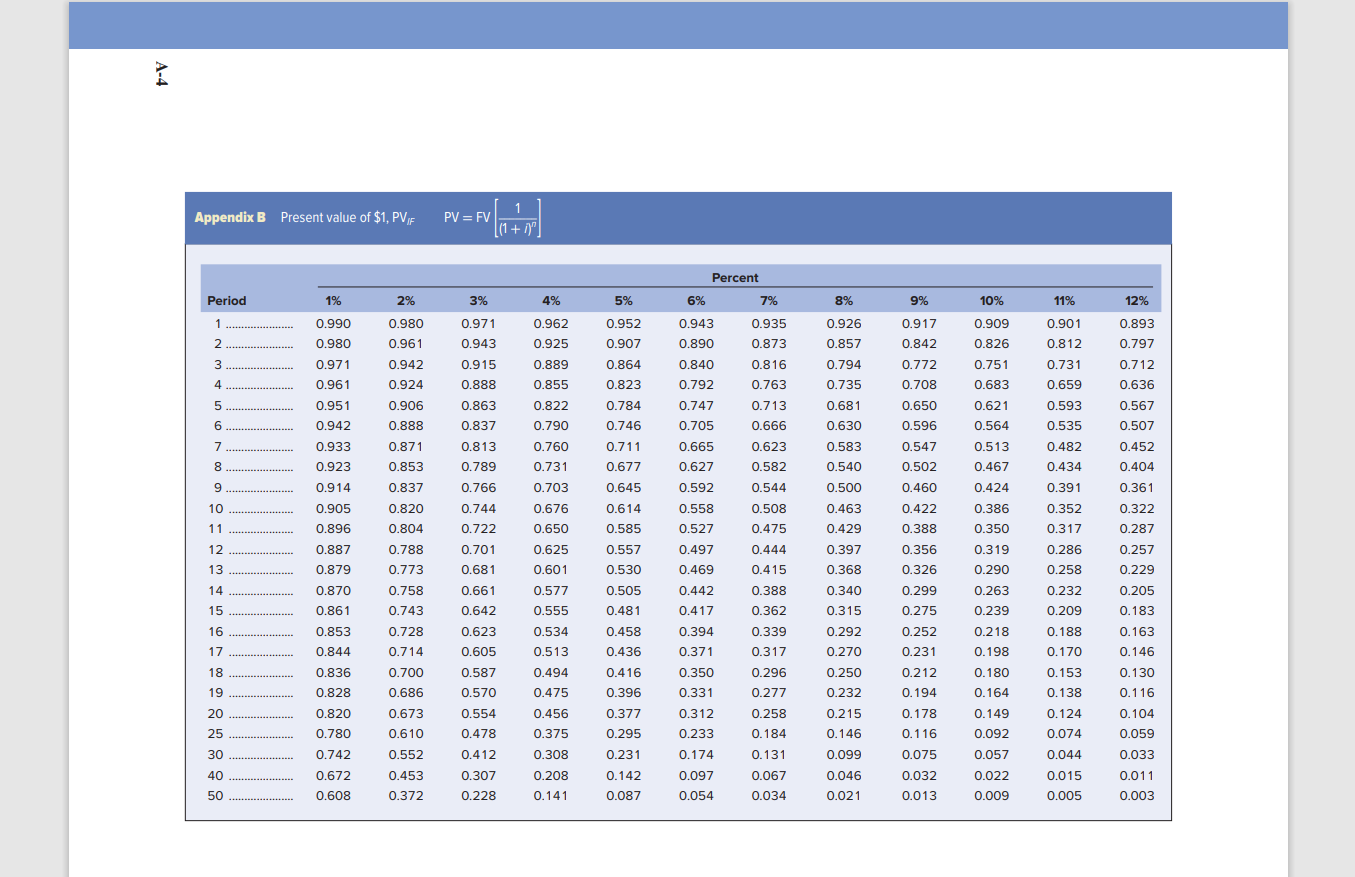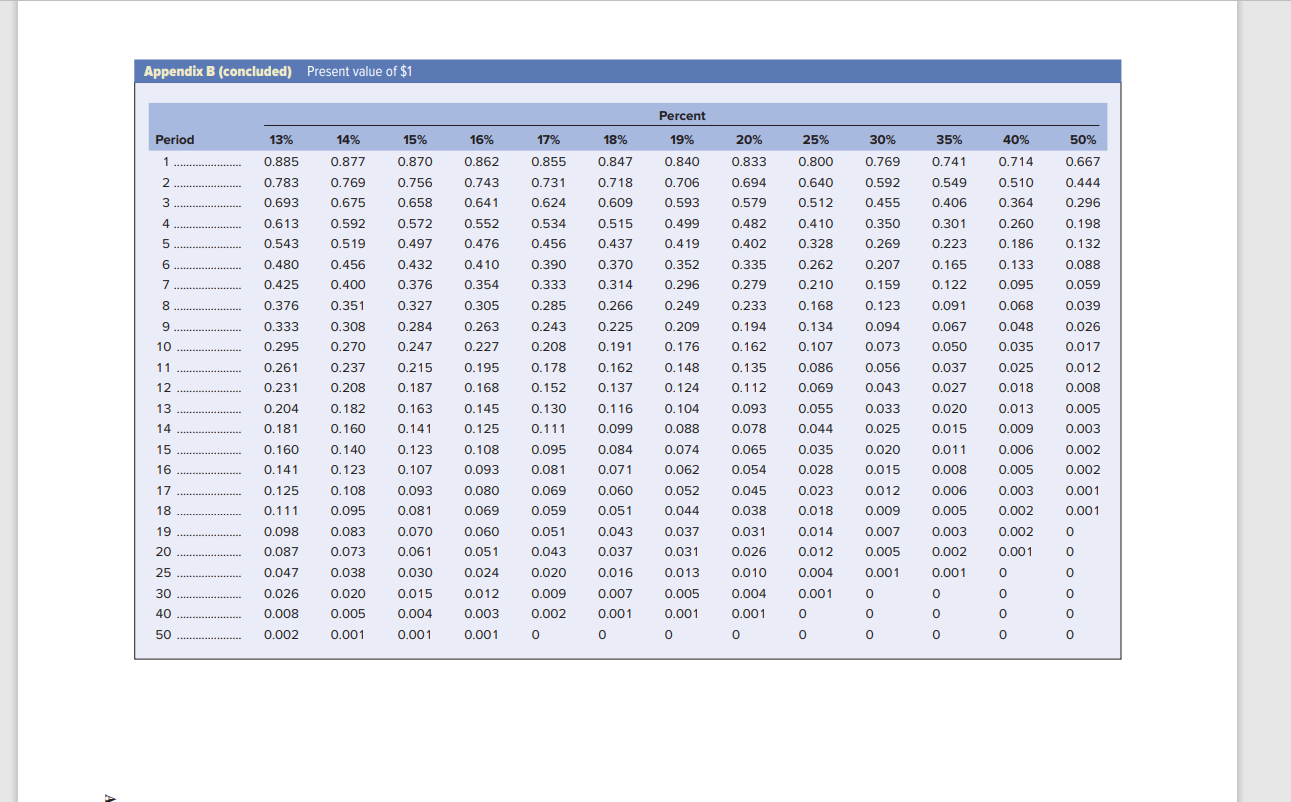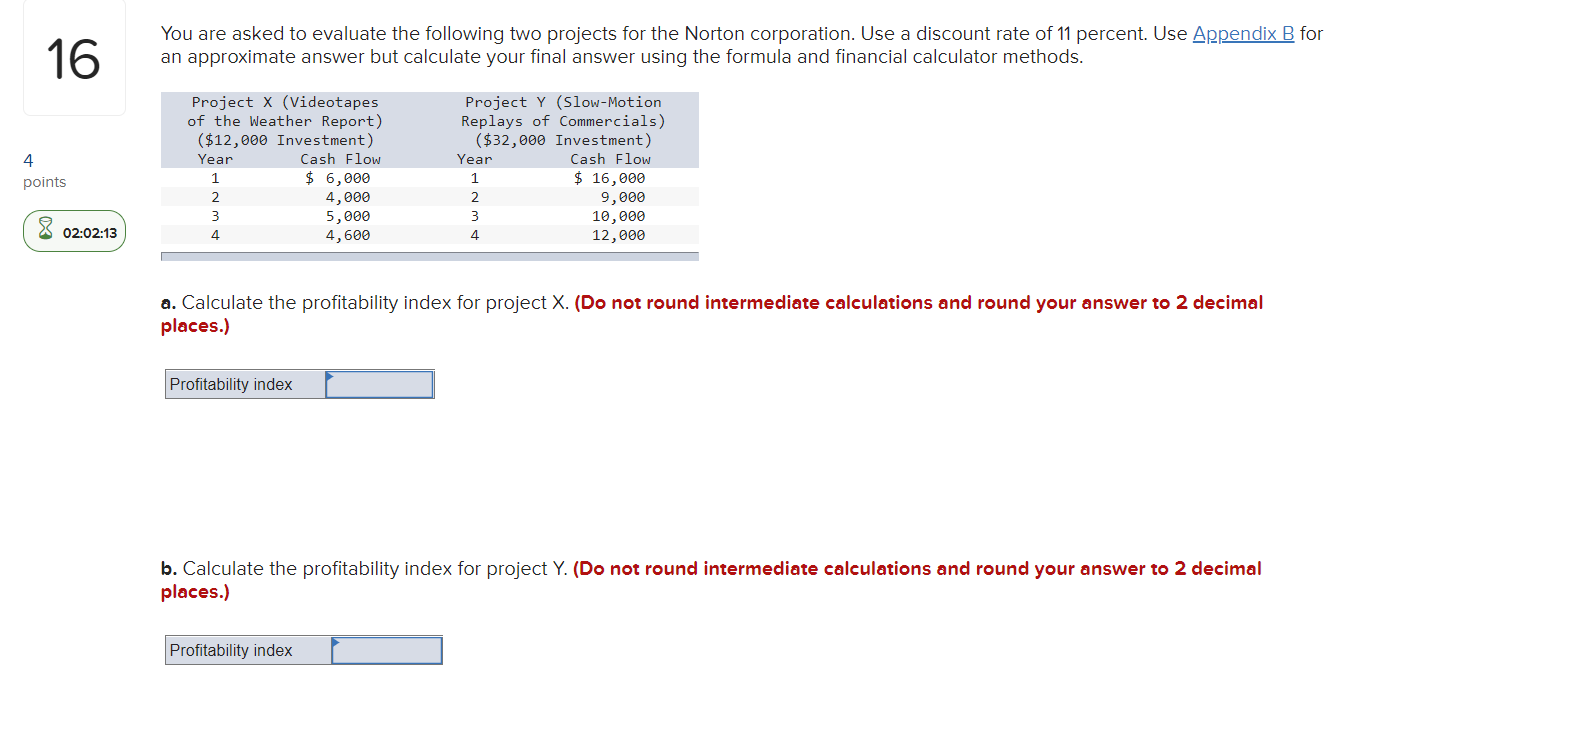


A-4 Appendix B Present value of $1, PVE 1 PV = FV 1 (1 + 7)" Percent Period 1% 3% 4% 6% 7% 8% 9% 11% 12% 0.971 1 2 0.990 0.980 0.962 0.925 0.889 0.943 0.890 10% 0.909 0.826 0.943 3 0.971 0.840 0.915 0.888 % 2% 0.980 0.961 0.942 0.924 0.906 0.888 0.871 0.853 0.935 0.873 0.816 0.763 0.713 0.666 0.917 0.842 0.772 0.708 0.650 0.893 0.797 0.712 0.636 0.567 4 0.792 0.747 5 0.961 0.951 0.942 0.933 0.923 0.914 0.855 0.822 0.790 0.760 0.863 0.837 0.813 6 0.751 0.683 0.621 0.564 0.513 0.467 0.705 0.507 0.596 0.547 7 0.665 0.627 0.623 0.582 0.452 0.404 8 0.789 0.731 0.502 0.460 0.901 0.812 0.731 0.659 0.593 0.535 0.482 0.434 0.391 0.352 0.317 0.286 0.258 0.232 0.209 9 0.766 0.592 0.544 10 0.744 0.722 0.701 0.558 0.527 0.422 0.388 11 0.905 0.896 0.887 0.879 0.870 0.861 0.508 0.475 0.444 0.415 5% 5% 0.952 0.907 0.864 0.823 0.784 0.746 0.711 0.677 0.645 0.614 0.585 0.557 0.530 0.505 0.481 0.458 0.436 0.416 0.396 0.377 0.295 0.231 0.142 0.087 12 0.926 0.857 0.794 0.735 0.681 0.630 0.583 0.540 0.500 0.463 0.429 0.397 0.368 0.340 0.315 0.292 0.270 0.250 0.232 0.215 0.146 0.099 0.361 0.322 0.287 0.257 0.229 0.497 0.469 0.356 0.326 13 0.703 0.676 0.650 0.625 0.601 0.577 0.555 0.534 0.513 0.494 0.681 0.661 0.642 14 0.388 0.442 0.417 0.394 0.205 0.183 15 0.362 0.837 0.820 0.804 0.788 0.773 0.758 0.743 0.728 0.714 0.700 0.686 0.673 0.610 0.552 0.453 0.372 16 0.853 0.188 0.623 0.605 0.424 0.386 0.350 0.319 0.290 0.263 0.239 0.218 0.198 0.180 0.164 0.149 0.092 0.057 0.022 0.009 0.163 0.146 17 0.339 0.317 0.296 0.844 0.371 0.170 18 0.836 0.587 0.299 0.275 0.252 0.231 0.212 0.194 0.178 0.116 0.075 0.032 0.350 19 0.828 0.570 0.475 0.277 20 0.130 0.116 0.104 0.059 0.554 0.258 0.820 0.780 0.331 0.312 0.233 0.174 25 0.184 0.153 0.138 0.124 0.074 0.044 0.015 0.005 30 0.456 0.375 0.308 0.208 0.141 0.478 0.412 0.307 0.742 0.131 0.033 40 0.672 0.067 0.046 0.097 0.054 0.011 0.003 50 0.608 0.228 0.034 0.021 0.013 Appendix B (concluded) Present value of $1 Percent 14% 15% 16% 17% 18% 19% 20% 25% 30% 35% 40% 50% 13% 0.885 0.783 0.877 0.870 0.855 0.847 0.840 0.833 Period 1 2 3 0.769 0.862 0.743 0.741 0.549 0.714 0.510 0.667 0.444 0.769 0.731 0.718 0.800 0.640 0.512 0.706 0.756 0.658 0.592 0.694 0.579 0.675 0.641 0.624 0.609 0.455 0.406 0.364 0.296 0.693 0.613 4 0.592 0.534 0.515 0.593 0.499 0.419 0.552 0.476 0.198 0.482 0.402 0.410 0.328 0.350 0.269 0.301 0.223 0.260 0.186 5 0.543 0.519 0.456 0.437 0.132 6 0.480 0.262 0.088 0.456 0.400 0.410 0.354 0.390 0.333 0.352 0.296 0.335 0.279 0.207 0.159 0.165 0.122 7 0.425 0.059 0.210 0.168 8 0.351 0.249 0.233 0.091 9 0.376 0.333 0.295 0.572 0.497 0.432 0.376 0.327 0.284 0.247 0.215 0.187 0.163 0.141 0.305 0.263 0.227 0.370 0.314 0.266 0.225 0.191 0.162 0.137 0.209 0.176 0.194 0.162 0.134 0.107 0.123 0.094 0.073 0.133 0.095 0.068 0.048 0.035 0.025 0.018 0.039 0.026 0.017 10 0.308 0.270 0.237 0.208 0.182 0.160 11 0.261 0.012 0.195 0.168 0.148 0.124 0.086 0.069 0.056 0.043 12 0.231 0.008 0.135 0.112 0.093 0.078 13 0.104 0.005 0.204 0.181 0.145 0.125 0.055 0.044 0.033 0.025 0.013 0.009 0.067 0.050 0.037 0.027 0.020 0.015 0.011 0.008 0.006 0.005 14 0.088 0.003 15 0.074 0.035 0.116 0.099 0.084 0.071 0.060 0.002 0.160 0.141 0.125 0.140 0.123 0.108 0.093 0.080 16 0.285 0.243 0.208 0.178 0.152 0.130 0.111 0.095 0.081 0.069 0.059 0.051 0.043 0.020 0.009 0.002 o 0 0.020 0.015 0.062 0.002 17 0.108 0.052 0.012 0.001 0.065 0.054 0.045 0.038 0.031 0.026 0.006 0.005 0.003 0.002 0.002 0.028 0.023 0.018 0.014 18 0.051 0.044 0.009 0.001 0.111 0.098 19 0.123 0.107 0.093 0.081 0.070 0.061 0.030 0.015 0.004 0.001 0.069 0.060 0.051 0.003 0 0.037 0.031 0.007 0.005 20 0.087 0.002 0 0.095 0.083 0.073 0.038 0.020 0.005 0.001 0.043 0.037 0.016 0.007 0.047 0.024 0.013 0.001 0.012 0.004 0.001 25 30 40 0.001 0 0.010 0.004 0.001 o 0 o 0.026 0.012 0.005 0 0 0.003 0.001 0.001 0.001 0 o 0.008 0.002 0 50 0.001 0 0 0 0 0 0 0 16 You are asked to evaluate the following two projects for the Norton corporation. Use a discount rate of 11 percent. Use Appendix B for an approximate answer but calculate your final answer using the formula and financial calculator methods. 4 points Project X (Videotapes of the Weather Report) ($12,000 Investment) Year Cash Flow 1 $ 6,000 2 4,000 3 5,000 4 4,600 Project Y (Slow-Motion Replays of Commercials) ($32,000 Investment) Year Cash Flow 1 $ 16,000 2 9,000 3 10,000 4 12,000 X 02:02:13 a. Calculate the profitability index for project X. (Do not round intermediate calculations and round your answer to 2 decimal places.) Profitability index b. Calculate the profitability index for project Y. (Do not round intermediate calculations and round your answer to 2 decimal places.) Profitability index c. Which project would you select based on the profitability index? O Project X O Project Y


