

Answered step by step
Verified Expert Solution
Question
1 Approved Answer
(a)-60 Hz 10F R 100 16. What is f, for each filter in Figure 18-43? Determine the output voltage at f, in each case
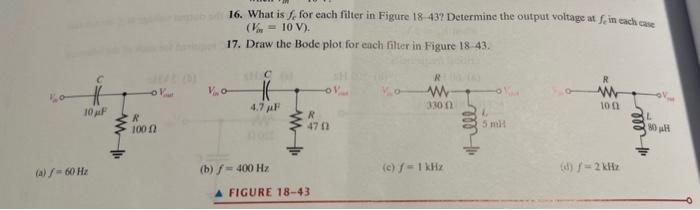
(a)-60 Hz 10F R 100 16. What is f, for each filter in Figure 18-43? Determine the output voltage at f, in each case (V = 10 V). 17. Draw the Bode plot for each filter in Figure 18-43. o Vo- 4.7 F R 470 ww 330 n m L 5 m R ww 100 L 80H (b) f=400 Hz A FIGURE 18-43 (c) f-1 kHz (d)/-2 kHz
Step by Step Solution
There are 3 Steps involved in it
Step: 1
The question seems incomplete as it references a Fi...
Get Instant Access to Expert-Tailored Solutions
See step-by-step solutions with expert insights and AI powered tools for academic success
Step: 2

Step: 3
Ace Your Homework with AI
Get the answers you need in no time with our AI-driven, step-by-step assistance
Get Started
Building Serverless Applications With Google Cloud Run A Real World Guide To Building Production Ready Services
Authors: Wietse Venema
1st Edition
1492057096, 978-1492057093