

Question: AA 11-2 Comparative Analysis LO P3, P4 Assume that Google invests $2.42 billion in capital expenditures, including $1.08 billion related to manufacturing capacity. Assume that
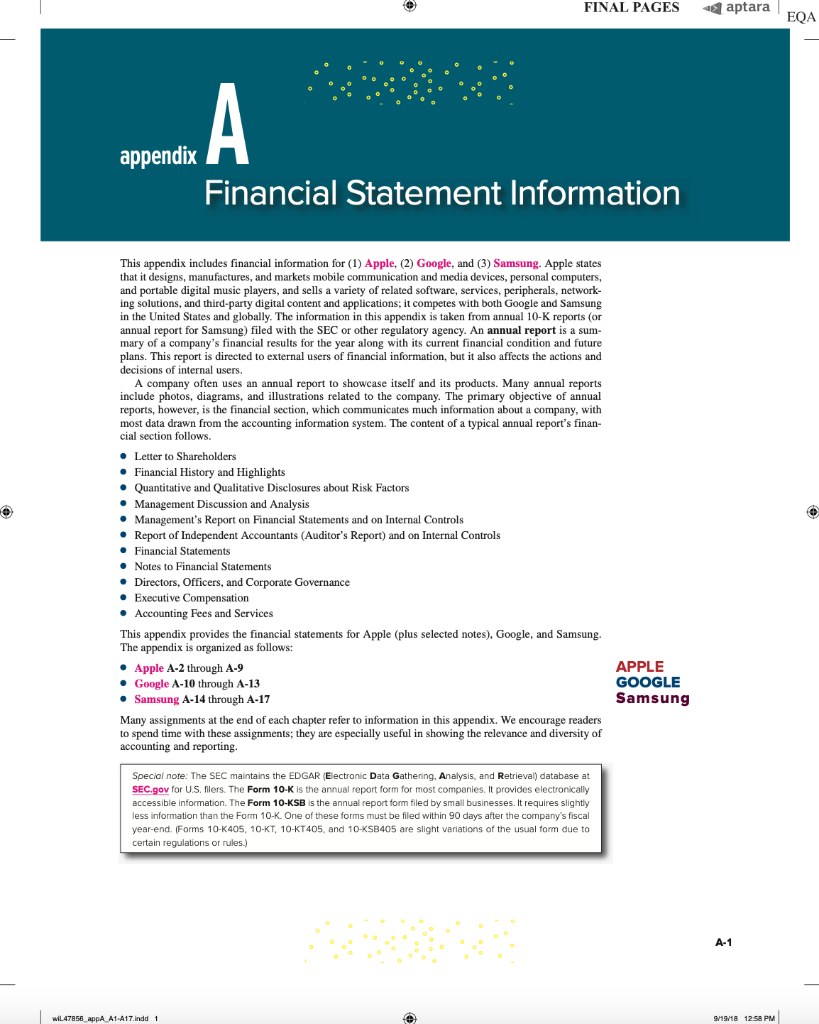
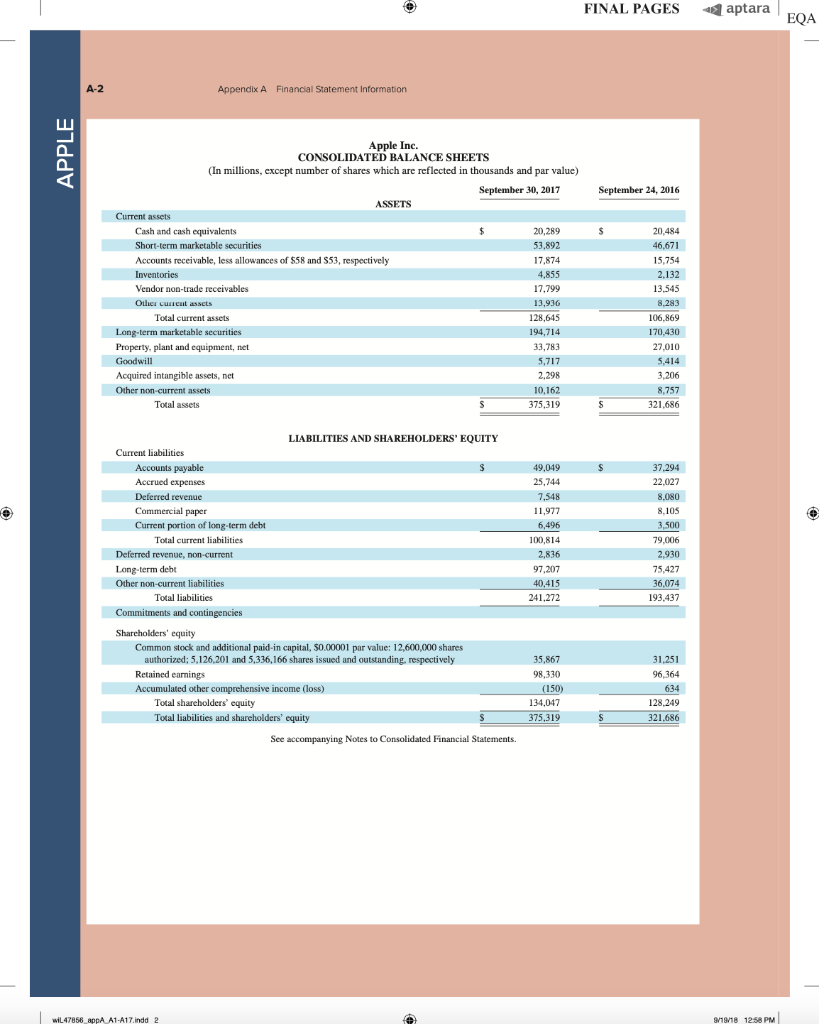
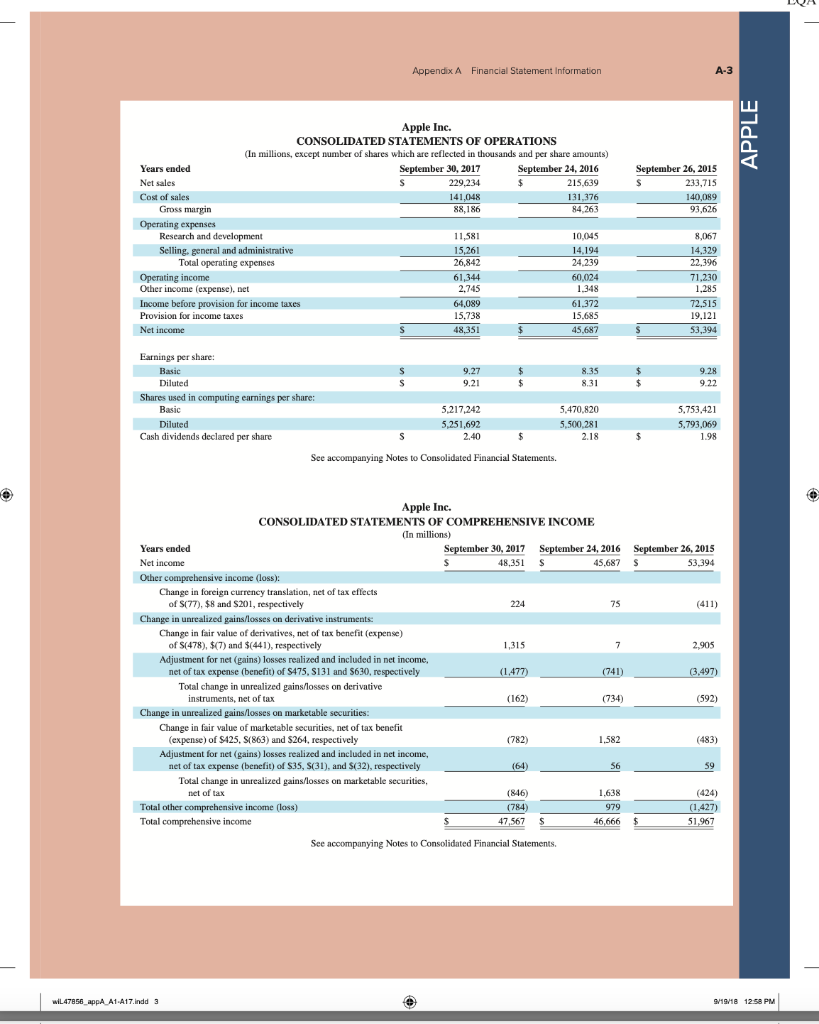
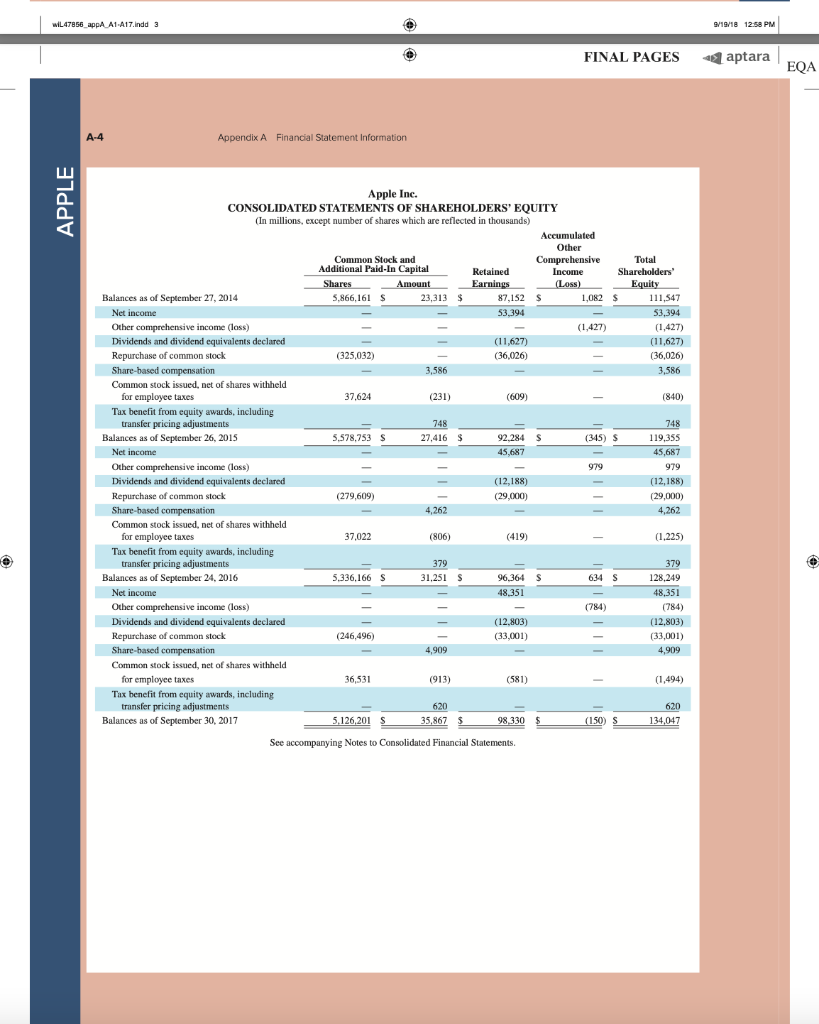
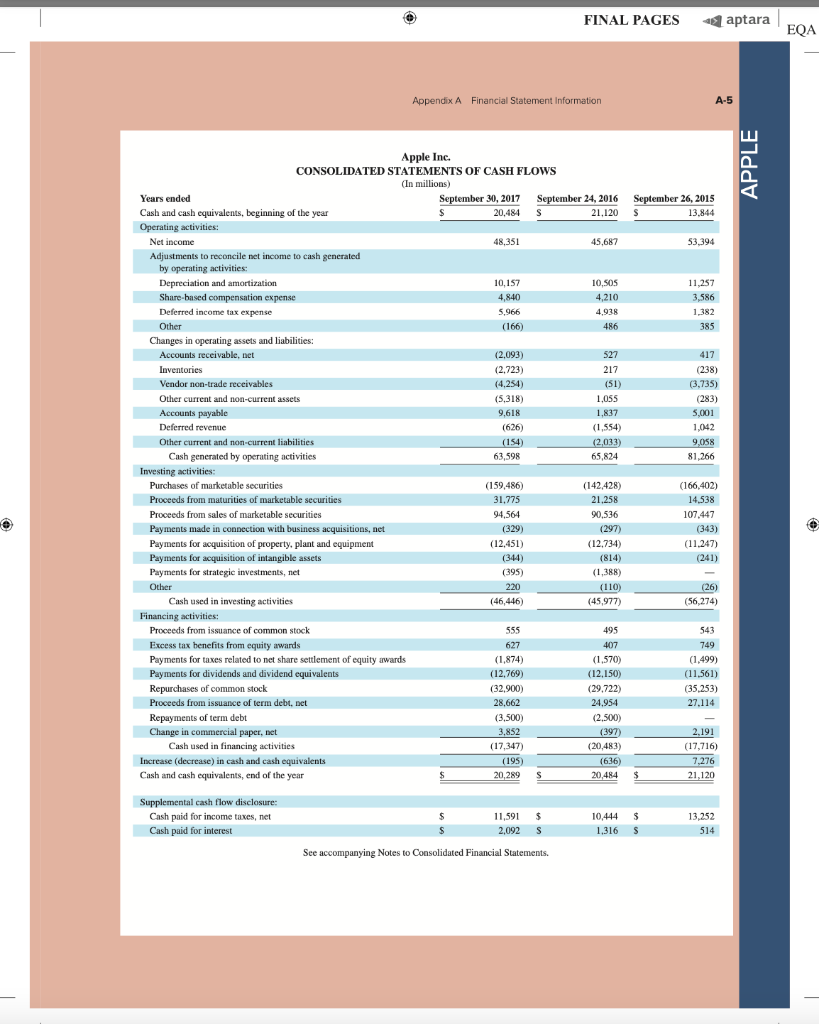
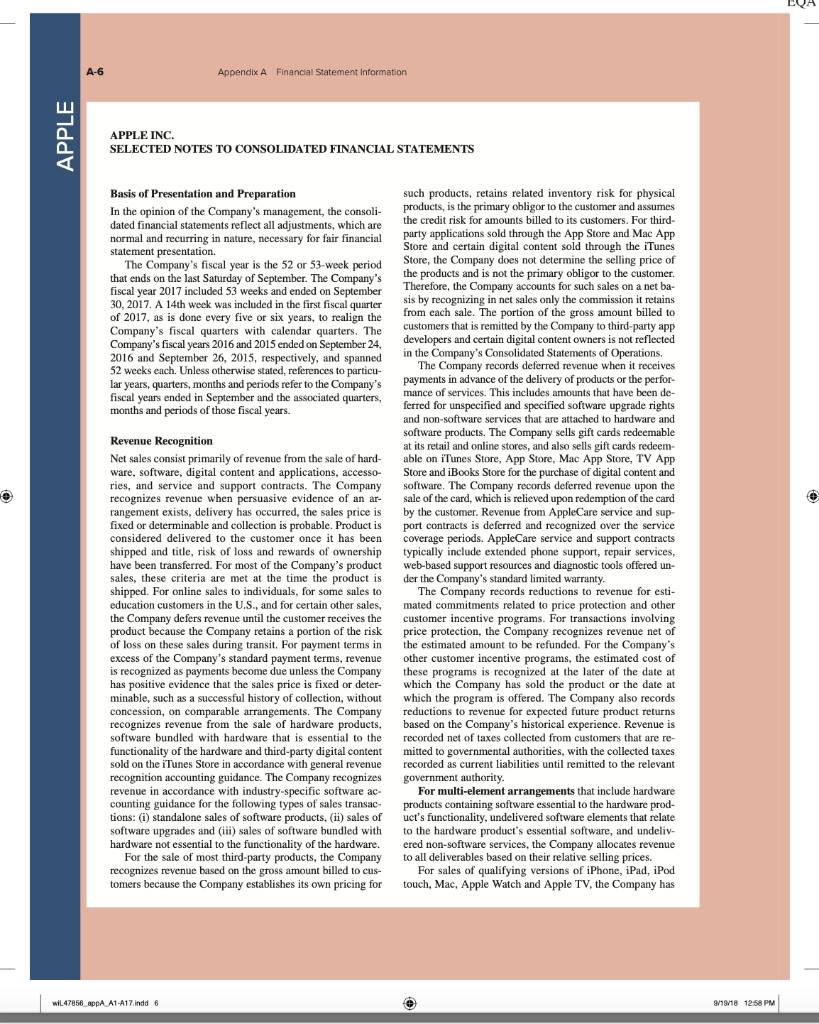
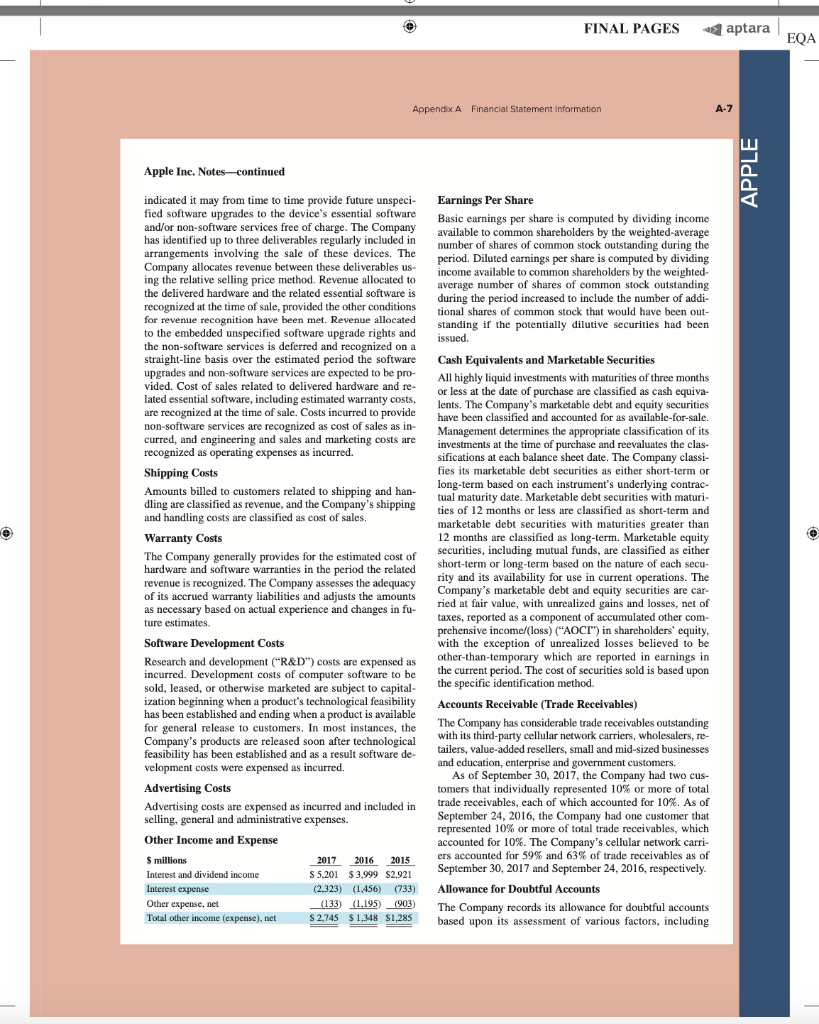
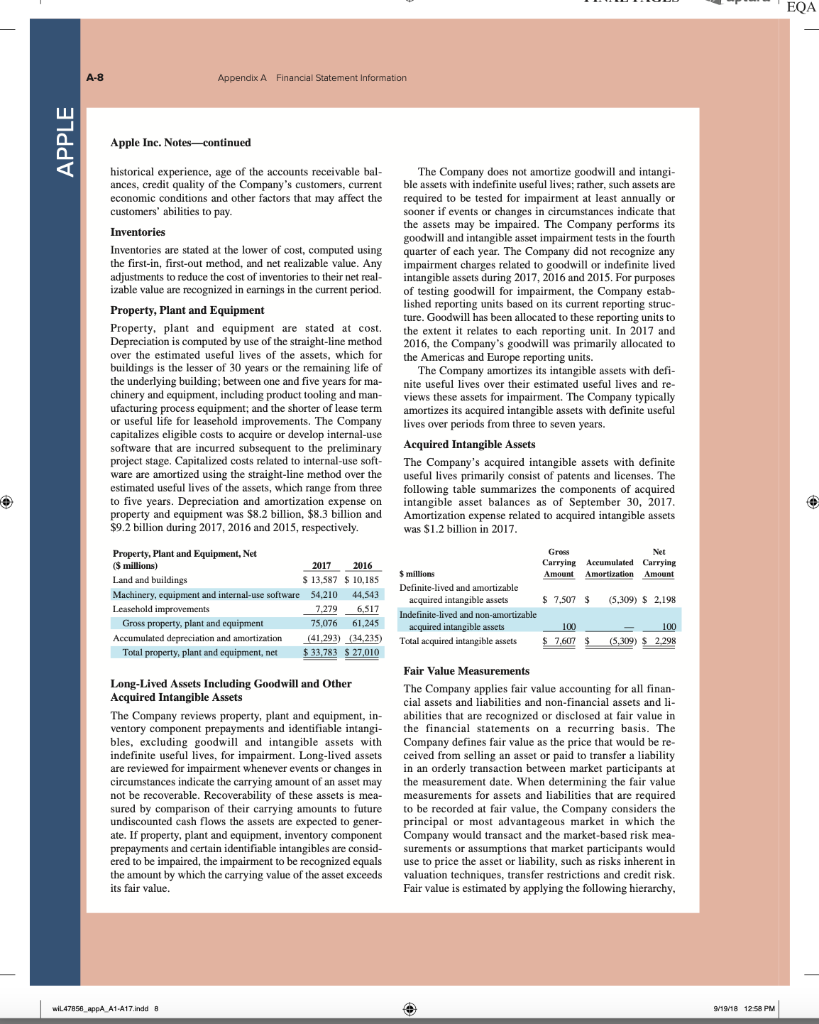
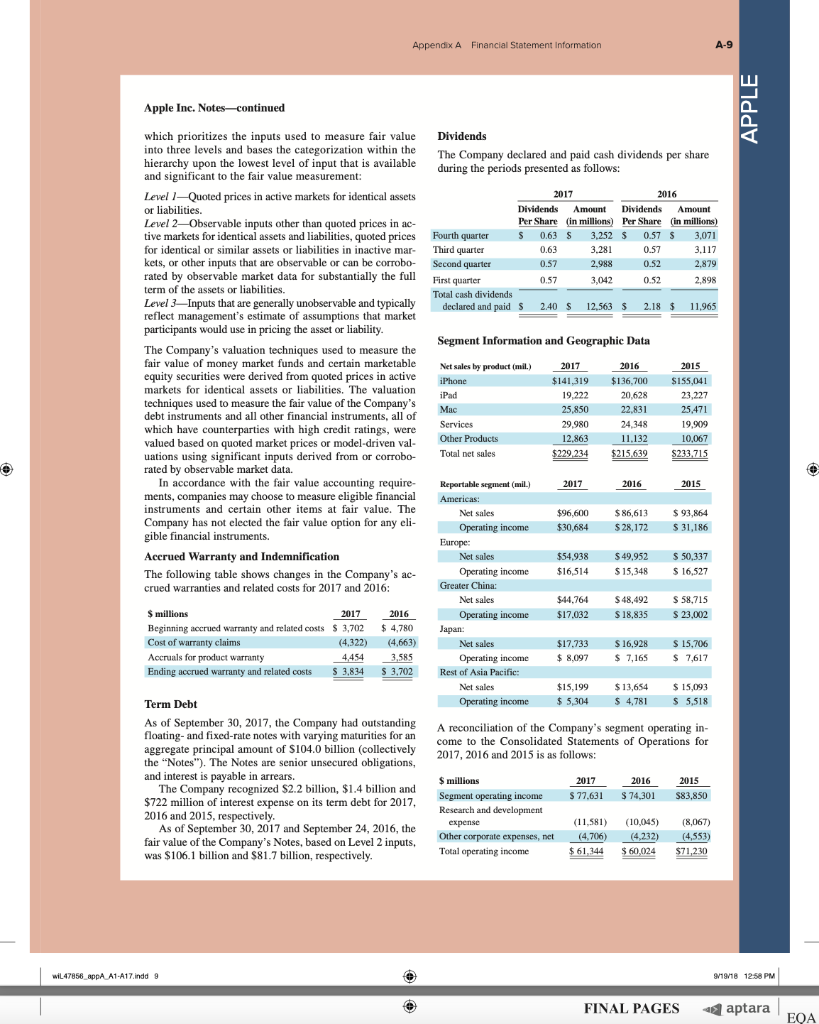
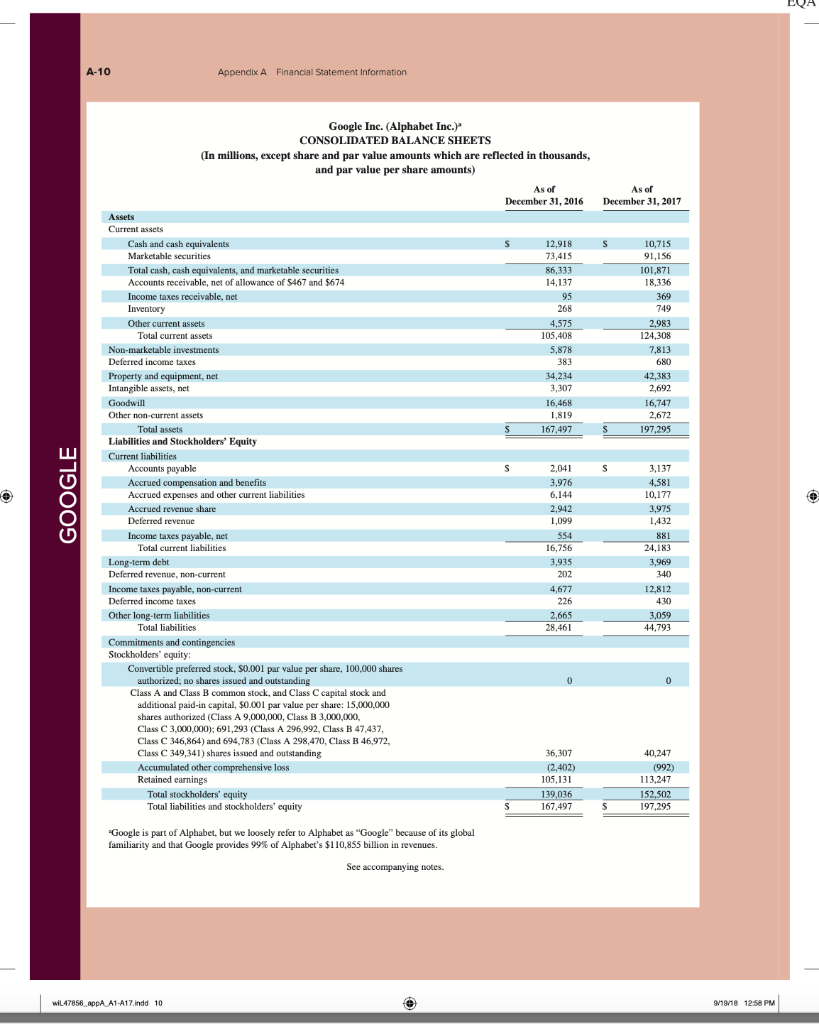
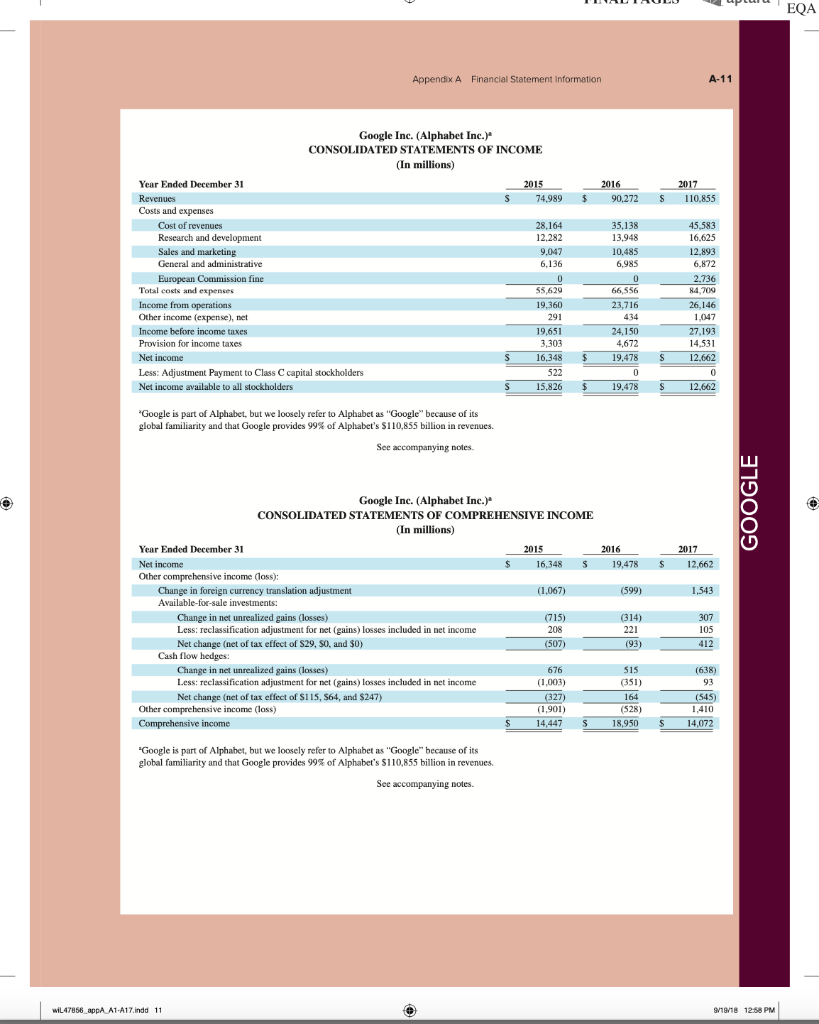
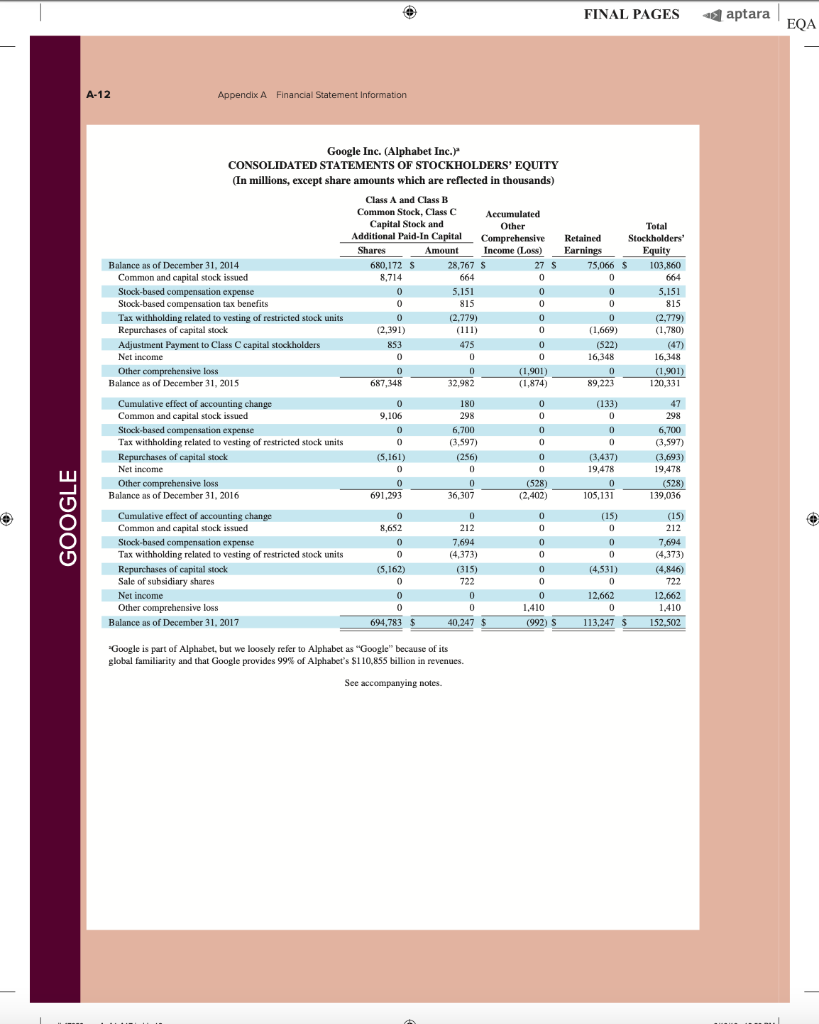
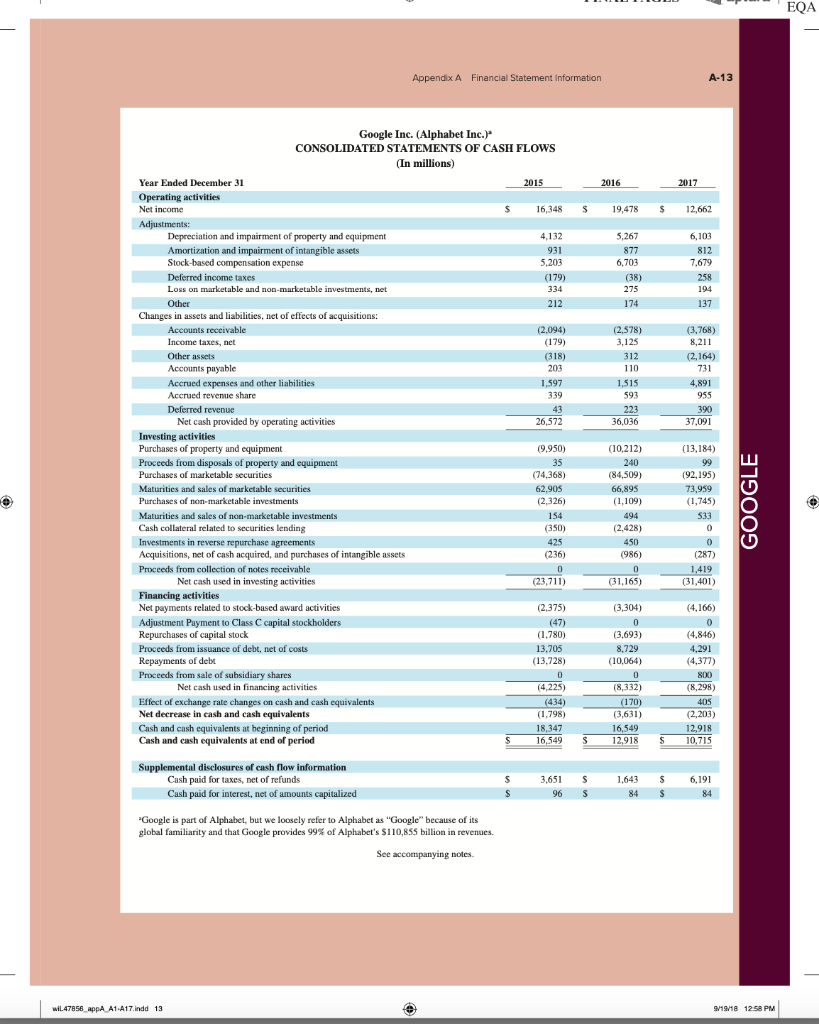
AA 11-2 Comparative Analysis LO P3, P4 Assume that Google invests $2.42 billion in capital expenditures, including $1.08 billion related to manufacturing capacity. Assume that these projects have a seven-year life and that management requires a 15% internal rate of return on those projects. (PV of $1, FV of $1, PVA of $1, and FVA of $1) (Use appropriate factor(s) from the tables provided.) Required 1. What is the amount of annual cash flows that Google must earn from those expenditures to achieve a 15% internal rate of return? (Hint. Identify the seven-period, 15% factor from the present value of an annuity table and then divide $2.42 billion by the factor to get the annual cash flows required.) 2. Refer to the financial statements in Appendix A. Identify the amount that Google invested in capital assets for the year ended December 31, 2017. 3. Did Google or Apple invest more in capital assets for 2017? Complete this question by entering your answers in the tabs below. Required 1 Required 2 Required 3 What is the amount of annual cash flows that Google must earn from those expenditures to achieve a 15% internal rate of return? (Hint: Identify the seven-period, 15% factor from the present value of an annuity table and then divide $1.08 billion by the factor to get the annual cash flows required.) (Round your answer to the nearest whole dollar.) Annual cash flows per year AA 11-2 Comparative Analysis LO P3, P4 Assume that Google invests $2.42 billion in capital expenditures, including $1.08 billion related to manufacturing capacity. Assume that these projects have a seven-year life and that management requires a 15% internal rate of return on those projects. (PV of $1, FV of $1, PVA of $1, and FVA of $1) (Use appropriate factor(s) from the tables provided.) Required 1. What is the amount of annual cash flows that Google must earn from those expenditures to achieve a 15% internal rate of return? (Hint. Identify the seven-period, 15% factor from the present value of an annuity table and then divide $2.42 billion by the factor to get the annual cash flows required.) 2. Refer to the financial statements in Appendix A. Identify the amount that Google invested in capital assets for the year ended December 31, 2017. 3. Did Google or Apple invest more in capital assets for 2017? Complete this question by entering your answers in the tabs below. Required 1 Required 2. Required 3 Refer to the financial statements in Appendix A. Identify the amount that Google invested in capital assets for the year ended December 31, 2017. (Enter your answer in millions.) Amount invested in capital assets million AA 11-2 Comparative Analysis LO P3, P4 Assume that Google invests $2.42 billion in capital expenditures, including $1.08 billion related to manufacturing capacity. Assume that these projects have a seven-year life and that management requires a 15% internal rate of return on those projects. (PV of $1, FV of $1, PVA of $1, and FVA of $1) (Use appropriate factor(s) from the tables provided.) Required 1. What is the amount of annual cash flows that Google must earn from those expenditures to achieve a 15% internal rate of return? (Hint. Identify the seven-period, 15% factor from the present value of an annuity table and then divide $2.42 billion by the factor to get the annual cash flows required.) 2. Refer to the financial statements in Appendix A. Identify the amount that Google invested in capital assets for the year ended December 31, 2017. 3. Did Google or Apple invest more in capital assets for 2017? Complete this question by entering your answers in the tabs below. Required 1 Required 2 Required 3 Did Google or Apple invest more in capital assets for 2017? Did Google or Apple invest more in capital assets for 2017? FINAL PAGES aptara EQA A appendix Financial Statement Information This appendix includes financial information for (1) Apple (2) Google, and (3) Samsung. Apple states that it designs, manufactures, and markets mobile communication and media devices, personal computers, and portable digital music players, and sells a variety of related software, services, peripherals, network- ing solutions, and third-party digital content and applications; it competes with both Google and Samsung in the United States and globally. The information in this appendix is taken from annual 10-K reports (or annual report for Samsung) filed with the SEC or other regulatory agency. An annual report is a sum- mary of a company's financial results for the year along with its current financial condition and future plans. This report is directed to external users of financial information, but it also affects the actions and decisions of internal users. A company often uses an annual report to showcase itself and its products. Many annual reports include photos, diagrams, and illustrations related to the company. The primary objective of annual reports, however, is the financial section, which communicates much information about a company, with most data drawn from the accounting information system. The content of a typical annual report's finan- cial section follows. Letter to Shareholders Financial History and Highlights Quantitative and Qualitative Disclosures about Risk Factors Management Discussion and Analysis Management's Report on Financial Statements and on Internal Controls Report of Independent Accountants (Auditor's Report) and on Internal Controls Financial Statements Notes to Financial Statements Directors, Officers, and Corporate Governance Executive Compensation Accounting Fees and Services This appendix provides the financial statements for Apple (plus selected notes), Google, and Samsung. The appendix is organized as follows: Apple A-2 through A-9 Google A-10 through A-13 Samsung A-14 through A-17 Many assignments at the end of each chapter refer to information in this appendix. We encourage readers to spend time with these assignments, they are especially useful in showing the relevance and diversity of accounting and reporting. APPLE GOOGLE Samsung Special note: The SEC maintains the EDGAR (Electronic Data Gathering, Analysis, and Retrieval) database at SEC.gov for U.S. filers. The Form 10-K is the annual report form for most companies. It provides electronically accessible information. The Form 10-KSB is the annual report form filed by small businesses. It requires slightly less information than the Form 10-K. One of these forms must be filed within 90 days after the company's fiscal year-end. (Forms 10-K405, 10-KT, 10-KT405, and 10-KSB405 are slight variations of the usual form due to certain regulations or rules.) A-1 WiL47856 appA A1 A17.indd 1 o 9/19/18 12:58 PM FINAL PAGES aptara EQA A-2 Appendix A Financial Statement Information Apple Inc. APPLE CONSOLIDATED BALANCE SHEETS (In millions, except number of shares which are reflected in thousands and par value) September 30, 2017 September 24, 2016 ASSETS Current assets Cash and cash equivalents $ $ 20,484 20,289 53,892 Short-term marketable securities 46,671 Accounts receivable, less allowances of $58 and 553, respectively 17,874 15,754 Inventories 4,855 2,132 Vendor non-trade receivables 17.799 13.545 Other current assets 13,936 8.283 Total current assets 128,645 106,869 194,714 170,430 Long-term marketable securities Property, plant and equipment, net Goodwill 33,783 27,010 5,717 5,414 2.298 3,206 Acquired intangible assets, net Other non-current assets - 10.162 8,757 Total assets 375,319 S 321.686 LIABILITIES AND SHAREHOLDERS' EQUITY ' Current liabilities S $ 37.294 49,049 25,744 22.027 7,548 8.080 11,977 8,105 6,496 3,500 Accounts payable Accrued expenses Deferred revenue Commercial paper Current portion of long-term debt Total current liabilities Deferred revenue, non-current Long-term debt Other non-current liabilities Total liabilities 100,814 79.006 2,836 2.930 97,207 75,427 40,415 36,074 241,272 193.437 Commitments and contingencies 31,251 Shareholders' equity Common stock and additional paid-in capital, $0.00001 par value: 12,600,000 shares authorized; 5,126,201 and 5,336,166 shares issued and outstanding, respectively Retained earnings Accumulated other comprehensive income (loss) Total shareholders' equity Total liabilities and shareholders' equity 35,867 98,330 96,364 (150) 634 134,047 128.249 375,319 S 321.686 See accompanying Notes to Consolidated Financial Statements WIL47856 appA A1-A17.indd 2 9/19/18 12:58 PM Appendix A Financial Statement information A-3 APPLE September 24, 2016 September 26, 2015 S 233.715 140,089 93,626 Apple Inc. CONSOLIDATED STATEMENTS OF OPERATIONS (In millions, except number of shares which are reflected in thousands and per share amounts) Years ended September 30, 2017 Net sales s 229.234 $ 215.639 Cost of sales 141,048 131,376 Gross margin 88,186 84.263 Operating expenses Research and development 11,581 10,045 Selling, general and administrative 15.261 14.194 Total operating expenses 26,842 24.239 Operating income 61,344 60,024 Other income (expense), net 2,745 1.348 Income before provision for income taxes 64,089 61.372 Provision for income taxes 15,738 15.685 Net income 48,351 45.687 8,067 14,329 22,396 71,230 1,285 72,515 19,121 53,394 Earnings per share: Basic S 9.27 $ 8.35 9.28 $ $ Diluted s 9.21 $ 8.31 9.22 Shares used in computing earnings per share: Basic 5,217.242 5,470,820 5,753,421 Diluted Cash dividends declared per share 5,251,692 2.40 5,500,281 2.18 5,793,069 1.98 S $ $ See accompanying Notes to Consolidated Financial Statements, Apple Inc. CONSOLIDATED STATEMENTS OF COMPREHENSIVE INCOME (In millions) Years ended September 30, 2017 September 24, 2016 September 26, 2015 48,351 S 45,6875 53,394 Net income 224 75 (411) 1,315 7 2,905 (1,477) (741) (3.497) Other comprehensive income (loss): Change in foreign currency translation, net of tax effects of $(77), $8 and $201, respectively Change in unrealized gains/losses an derivative instruments Change in fair value of derivatives, net of tax benefit (expense) of S(478), $(7) and $(441), respectively Adjustment for niet (gains) losses realized and included in net income, net of tax expense (benefit) of S475,5131 and 5630, respectively Total change in unrealized gains/losses on derivative instruments, net of tax Change in unrealized gains/losses on marketable securities: Change in fair value of marketable securities, net of tax benefit (expense) of $425, 8(863) and $264, respectively Adjustment for net(gains) losses realized and included in net income, net of tax expense (benefit of $35, $(31), and $(32), respectively Total change in unrealized gains/losses on marketable securities, net of tax (162) (734) (592) (782) 1.582 (483) (64) 56 59 1.638 (846) (784 (424) (1,427) Total other comprehensive income (loss) 979 Total comprehensive income $ 47,567 $ 46,666 $ 51,967 See accompanying Notes to Consolidated Financial Statements. wiL47856_appA A1 A17.indd 3 9/19/18 12:58 PM wiL47856_appA A1-A17.indd 3 9/19/18 12:58 PM FINAL PAGES aptara EQA A-4 Appendix A Financial Statement Information APPLE Apple Inc. CONSOLIDATED STATEMENTS OF SHAREHOLDERS' EQUITY (In millions, except number of shares which are reflected in thousands) Common Stock and Additional Paid-In Capital Shares Amount 5.866,161 S 23,313 $ Accumulated Other Comprehensive Income (Loss) Retained Earnings Total Shareholders Equity 87,152 $ 1,082 $ 111,547 53.394 53,394 (1,427) (1,427) (11,627) (11,627) (325,032) (36,026) (36,026) 3,586 3,586 Balances as of September 27, 2014 Net income Other comprehensive income (loss) Dividends and dividend equivalents declared Repurchase of common stock Share-based compensation Common stock issued, net of shares withheld for employee taxes Tax benefit from equity awards, including transfer pricing adjustments Balances as of September 26, 2015 Net income 37.624 (231) (609 (840) 748 27,416 $ 748 119,355 5.578,753 S 92.284 s (345) S 45.687 45,687 979 979 (12,188) (279,609) (29,000) (12,188) (29,000) ( 4,262 4,262 37,022 (806) (419) (1,225) 379 379 5,336,166 S 31.251s 96,364 $ 634 S Other comprehensive income (loss) Dividends and dividend equivalents declared Repurchase of common stock Share-based compensation Common stock issued, net of shares withheld for employee taxes Tax benefit from equity awards, including transfer pricing adjustments Balances as of September 24, 2016 Net income Other comprehensive income (loss) Dividends and dividend equivalents declared Repurchase of common stock Share-based compensation Common stock issued, net of shares withheld for employee taxes Tax benefit from equity awards, including transfer pricing adjustments Balances as of September 30, 2017 48,351 (784) 128,249 48,351 (784) (12,803) ) (33,001) (12.803) (33.001) (246,496 4,909 4,909 36,531 (913) (581) (1,494) 620 620 5,126,2015 35,867 $ 98,330 $ (1.50) S 134,047 See accompanying Notes to Consolidated Financial Statements. FINAL PAGES aptara EQA Appendix A Financial Statement Information A-5 Apple Inc. CONSOLIDATED STATEMENTS OF CASH FLOWS (In millions) APPLE Years ended September 30, 2017 September 24, 2016 September 26, 2015 13.844 $ 20,484 S 21.120 Cash and cash equivalents, beginning of the year Operating activities: Net income 48,351 45,687 53,394 Adjustments to reconcile net income to cash generated by operating activities: Depreciation and amortization Share-based compensation expense Deferred income tax expense 10,505 11.257 10,157 4,840 4,210 3,586 5,966 4,938 1.382 Other (166) 486 385 Changes in operating assets and liabilities: Accounts receivable, net (2,093) 527 417 Inventories (2.723) 217 (238) (4,254) (51) (3,735) (5,318) 1,055 (283) Vendor non-trade receivables Other current and non-current assets Accounts payable Deferred revenue 9,618 1,837 5,001 (626) (1,554) 1,042 Other current and non-current liabilities (2,033) (154) 63,598 9,058 81,266 65,824 Cash generated by operating activities Investing activities: Purchases of marketable securities Proceeds from maturities of marketable securities (159,486) (166,402) (142,428) 21.258 31,775 14,538 Proceeds from sales of marketable securities 94,564 107,447 (329) (343) Payments made in connection with business acquisitions, net Payments for acquisition of property, plant and equipment Payments for acquisition of intangible assets Payments for strategic investments, net (12.451) (344) (395) 90,536 (297) (12.734) (814) (1,388) (11.247) (241) Other 220 (110) (26) Cash used in investing activities (46,446 (45,977 (56,274) Financing activities: Proceeds from issuance of common stock 555 495 543 627 407 749 (1,570) (12.150) (1,499) (11,561) (29,722) (35,253) 24,954 27.114 Excess tax benefits from equity awards Payments for taxes related to net share settlement of equity awards Payments for dividends and dividend equivalents Repurchases of common stock Proceeds from issuance of term debt, net Repayments of term debt Change in commercial paper, net Cash used in financing activities Increase (decrease) in cash and cash equivalents Cash and cash equivalents, end of the year (1,874) (12,769) (32.900 28,662 (3,500) ) 3,852 (17,347 (195 20,289 (2,500) (397) (20,483 (636) 2.191 (17,716 7,276 $ s 20,484 $ 21,120 Supplemental cash flow disclosure: Cash paid for income taxes, net Cash paid for interest $ 11,591 $ 10,444 $ 13,252 2,092 S 1,316 S 514 See accompanying Notes to Consolidated Financial Statements. A-6 Appendix A. Financial Statement Information APPLE APPLE INC. SELECTED NOTES TO CONSOLIDATED FINANCIAL STATEMENTS Basis of Presentation and Preparation In the opinion of the Company's management, the consoli- dated financial statements reflect all adjustments, which are normal and recurring in nature, necessary for fair financial statement presentation. The Company's fiscal year is the 52 or 53-week period that ends on the last Saturday of September. The Company's fiscal year 2017 included 53 weeks and ended on September 30, 2017. A 14th week was included in the first fiscal quarter of 2017, as is done every five or six years, to realign the Company's fiscal quarters with calendar quarters. The Company's fiscal years 2016 and 2015 ended on September 24, 2016 and September 26, 2015, respectively, and spanned 52 weeks each. Unless otherwise stated, references to particu- lar years, quarters, months and periods refer to the Company's fiscal years ended in September and the associated quarters, months and periods of those fiscal years. Revenue Recognition Net sales consist primarily of revenue from the sale of hard- ware, software, digital content and applications, accesso- ries, and service and support contracts. The Company recognizes revenue when persuasive evidence of an ar- rangement exists, delivery has occurred, the sales price is fixed or determinable and collection is probable. Product is considered delivered to the customer once it has been shipped and title, risk of loss and rewards of ownership have been transferred. For most of the Company's product sales, these criteria are met at the time the product is shipped. For online sales to individuals, for some sales to education customers in the U.S., and for certain other sales, the Company defers revenue until the customer receives the product because the Company retains a portion of the risk of loss on these sales during transit. For payment terms in excess of the Company's standard payment terms, revenue is recognized as payments become due unless the Company has positive evidence that the sales price is fixed or deter- minable, such as a successful history of collection, without concession, on comparable arrangements. The Company recognizes revenue from the sale of hardware products, software bundled with hardware that is essential to the functionality of the hardware and third-party digital content sold on the iTunes Store in accordance with general revenue recognition accounting guidance. The Company recognizes revenue in accordance with industry-specific software ac- counting guidance for the following types of sales transac- tions: (i) standalone sales of software products, (ii) sales of software upgrades and (iii) sales of software bundled with hardware not essential to the functionality of the hardware. For the sale of most third-party products, the Company recognizes revenue based on the gross amount billed to cus- tomers because the Company establishes its own pricing for such products, retains related inventory risk for physical products, is the primary obligor to the customer and assumes the credit risk for amounts billed to its customers. For third- party applications sold through the App Store and Mac App Store and certain digital content sold through the iTunes Store, the Company does not determine the selling price of the products and is not the primary obligor to the customer Therefore, the Company accounts for such sales on a net ba- sis by recognizing in net sales only the commission it retains from each sale. The portion of the gross amount billed to customers that is remitted by the Company to third-party app developers and certain digital content owners is not reflected in the Company's Consolidated Statements of Operations The Company records deferred revenue when it receives payments in advance of the delivery of products or the perfor- mance of services. This includes amounts that have been de- ferred for unspecified and specified software upgrade rights and non-software services that are attached to hardware and software products. The Company sells gift cards redeemable at its retail and online stores, and also sells gift cards redeem- able on iTunes Store, App Store, Mac App Store, TV App Store and iBooks Store for the purchase of digital content and software. The Company records deferred revenue upon the sale of the card, which is relieved upon redemption of the card by the customer. Revenue from AppleCare service and sup- port contracts is deferred and recognized over the service coverage periods. AppleCare service and support contracts typically include extended phone support, repair services, web-based support resources and diagnostic tools offered un- der the Company's standard limited warranty. The Company records reductions to revenue for esti- mated commitments related to price protection and other customer incentive programs. For transactions involving price protection, the Company recognizes revenue net of the estimated amount to be refunded. For the Company's other customer incentive programs, the estimated cost of these programs is recognized at the later of the date at which the Company has sold the product or the date at which the program is offered. The Company also records reductions to revenue for expected future product returns based on the Company's historical experience. Revenue is recorded net of taxes collected from customers that are re- mitted to governmental authorities, with the collected taxes recorded as current liabilities until remitted to the relevant government authority. For multi-element arrangements that include hardware products containing software essential to the hardware prod- uct's functionality, undelivered software elements that relate to the hardware product's essential software, and undeliv- ered non-software services, the Company allocates revenue to all deliverables based on their relative selling prices. For sales of qualifying versions of iPhone, iPad, iPod touch, Mac, Apple Watch and Apple TV, the Company has wiL47856 appA A1-A17.indd 6 9/19/18 12:58 PM FINAL PAGES 4 aptara EQA Appendix A Financial Statement Information A-7 Apple Inc. Notes-continued APPLE Earnings Per Share Basic earnings per share is computed by dividing income available to common shareholders by the weighted average number of shares of common stock outstanding during the period. Diluted earnings per share is computed by dividing income available to common shareholders by the weighted- average number of shares of common stock outstanding during the period increased to include the number of addi- tional shares of common stock that would have been out- standing if the potentially dilutive securities had been issued. indicated it may from time to time provide future unspeci- fied software upgrades to the device's essential software and/or non-software services free of charge. The Company has identified up to three deliverables regularly included in arrangements involving the sale of these devices. The Company allocates revenue between these deliverables us- ing the relative selling price method. Revenue allocated to the delivered hardware and the related essential software is recognized at the time of sale, provided the other conditions for revenue recognition have been met. Revenue allocated to the embedded unspecified software upgrade rights and the non-software services is deferred and recognized on a straight-line basis over the estimated period the software upgrades and non-software services are expected to be pro- vided. Cost of sales related to delivered hardware and re- lated essential software, including estimated warranty costs, are recognized at the time of sale. Costs incurred to provide non-software services are recognized as cost of sales as in- curred, and engineering and sales and marketing costs are recognized as operating expenses incurred. Shipping Costs Amounts billed to customers related to shipping and han- dling are classified as revenue, and the Company's shipping and handling costs are classified as cost of sales. Cash Equivalents and Marketable Securities All highly liquid investments with maturities of three months or less at the date of purchase are classified cash equiva- lents. The Company's marketable debt and equity securities have been classified and accounted for as available-for-sale. Management determines the appropriate classification of its investments at the time of purchase and reevaluates the clas- sifications at each balance sheet date. The Company classi- fies its marketable debt securities as either short-term or long-term based on each instrument's underlying contrac- tual maturity date. Marketable debt securities with maturi- ties of 12 months or less are classified as short-term and marketable debt securities with maturities greater than 12 months are classified as long-term, Marketable equity securities, including mutual funds, are classified as either short-term or long-term based on the nature of each secu- rity and its availability for use in current operations. The Company's marketable debt and equity securities are car- ried at fair value, with unrealized gains and losses, net of taxes, reported as a component of accumulated other com- prehensive income/(loss) ("ACT") in shareholders' equity, with the exception of unrealized losses believed to be other-than-temporary which are reported in earnings in the current period. The cost of securities sold is based upon the specific identification method. Warranty Costs The Company generally provides for the estimated cost of hardware and software warranties in the period the related revenue is recognized. The Company assesses the adequacy of its accrued warranty liabilities and adjusts the amounts as necessary based on actual experience and changes in fu- ture estimates Software Development Costs Research and development ("R&D") costs are expensed as incurred. Development costs of computer software to be sold, leased, or otherwise marketed are subject to capital- ization beginning when a product's technological feasibility has been established and ending when a product is available for general release to customers. In most instances, the Company's products are released soon after technological feasibility has been established and as a result software de- velopment costs were expensed as incurred, Advertising Costs Accounts Receivable (Trade Receivables) The Company has considerable trade receivables outstanding with its third-party cellular network carriers, wholesalers, re- tailers, value-added resellers, small and mid-sized businesses and education, enterprise and government customers. As of September 30, 2017, the Company had two cus- tomers that individually represented 10% or more of total trade receivables, each of which accounted for 10%. As of September 24, 2016, the Company had one customer that represented 10% or more of total trade receivables, which accounted for 10%. The Company's cellular network carri- ers accounted for 59% and 63% of trade receivables as of September 30, 2017 and September 24, 2016, respectively. Advertising costs are expensed as incurred and included in selling, general and administrative expenses. Other Income and Expense $ millions Interest and dividend income Interest expense 2017 2016 2015 S5,201 $3.999 $2,921 (2,323) (1.456) (733) (133) (1.195 (903) $ 2,745 $1,348 $1,285 Allowance for Doubtful Accounts Other expense, net Total other income (expense), net The Company records its allowance for doubtful accounts based upon its assessment of various factors, including EQA A-8 Appendix A Financial Statement Information APPLE Apple Inc. Notes-continued historical experience, age of the accounts receivable bal- The Company does not amortize goodwill and intangi- ances, credit quality of the Company's customers, current ble assets with indefinite useful lives; rather, such assets are economic conditions and other factors that may affect the required to be tested for impairment at least annually or customers' abilities to pay sooner if events or changes in circumstances indicate that the assets may be impaired. The Company performs its Inventories goodwill and intangible asset impairment tests in the fourth Inventories are stated at the lower of cost, computed using quarter of each year. The Company did not recognize any the first-in, first-out method, and net realizable value. Any impairment charges related to goodwill or indefinite lived adjustments to reduce the cost of inventories to their net real- intangible assets during 2017, 2016 and 2015. For purposes izable value are recognized in earnings in the current period. of testing goodwill for impairment, the Company estab- Property, Plant and Equipment lished reporting units based on its current reporting struc- ture. Goodwill has been allocated to these reporting units to Property, plant and equipment are stated at cost. the extent it relates to each reporting unit. In 2017 and Depreciation is computed by use of the straight-line method 2016, the Company's goodwill was primarily allocated to over the estimated useful lives of the assets, which for the Americas and Europe reporting units. buildings is the lesser of 30 years or the remaining life of The Company amortizes its intangible assets with defi- the underlying building; between one and five years for ma- nite useful lives over their estimated useful lives and re- chinery and equipment, including product tooling and man- views these assets for impairment. The Company typically ufacturing process equipment; and the shorter of lease term amortizes its acquired intangible assets with definite useful or useful life for leasehold improvements. The Company lives over periods from three to seven years. capitalizes eligible costs to acquire or develop internal-use software that are incurred subsequent to the preliminary Acquired Intangible Assets project stage. Capitalized costs related to internal-use soft- The Company's acquired intangible assets with definite ware are amortized using the straight-line method over the useful lives primarily consist of patents and licenses. The estimated useful lives of the assets, which range from three following table summarizes the components of acquired to five years. Depreciation and amortization expense on intangible asset balances as of September 30, 2017 property and equipment was $8.2 billion, $8.3 billion and Amortization expense related to acquired intangible assets $9.2 billion during 2017, 2016 and 2015, respectively. was $1.2 billion in 2017. Gross Net Carrying Accumulated Carrying Amount Amortization Amount $ millions Property, Plant and Equipment, Net ($ millions) 2017 2016 Land and buildings $ 13,587 $ 10,185 Machinery, equipment and internal-use software 54,210 44,543 Leasehold improvements 7.279 6,517 Gross property, plant and equipment 75,076 61,245 Accumulated depreciation and amortization (41,293) (34,235) Total property, plant and equipment, net $33,783 $ 27,010 $ 7,507 $ (5,309) $ 2,198 Definite-lived and amortizable acquired intangible assets Indefinite-lived and non-amortizable acquired intangible assets Total acquired intangible assets 100 100 (5,309) $ 2.298 $ 7.607 $ Fair Value Measurements Long-Lived Assets Including Goodwill and Other Acquired Intangible Assets The Company reviews property, plant and equipment, in- ventory component prepayments and identifiable intangi- bles, excluding goodwill and intangible assets with indefinite useful lives, for impairment. Long-lived assets are reviewed for impairment whenever events or changes in circumstances indicate the carrying amount of an asset may not be recoverable. Recoverability of these assets is mea- sured by comparison of their carrying amounts to future undiscounted cash flows the assets are expected to gener- ate. If property, plant and equipment, inventory component prepayments and certain identifiable intangibles are consid- ered to be impaired, the impairment to be recognized equals the amount by which the carrying value of the asset exceeds its fair value. The Company applies fair value accounting for all finan- cial assets and liabilities and non-financial assets and li- abilities that are recognized or disclosed at fair value in the financial statements on a recurring basis. The Company defines fair value as the price that would be re- ceived from selling an asset or paid to transfer a liability in an orderly transaction between market participants at the measurement date. When determining the fair value measurements for assets and liabilities that are required to be recorded at fair value, the Company considers the principal or most advantageous market in which the Company would transact and the market-based risk mea- surements or assumptions that market participants would use to price the asset or liability, such as risks inherent in valuation techniques, transfer restrictions and credit risk. Fair value is estimated by applying the following hierarchy, wiL47856_AppA A1-A17.indd 9/19/18 12:58 PM Appendix A Financial Statement Information A-9 Apple Inc. Notes-continued APPLE Dividends which prioritizes the inputs used to measure fair value into three levels and bases the categorization within the hierarchy upon the lowest level of input that is available and significant to the fair value measurement: The Company declared and paid cash dividends per share during the periods presented as follows: 2017 2016 Dividends Amount 0.63 0.57 3,042 0.52 2,898 2.40 $ iPhone iPad 20,628 Mac Services Total net sales 2016 Americas: Net sales Level 1-Quoted prices in active markets for identical assets or liabilities. Dividends Amount Level 2Observable inputs other than quoted prices in ac- Per Share (in millions) Per Share (in millions) tive markets for identical assets and liabilities, quoted prices Fourth quarter $ 0.63 $ 3,2525 0.57 $ 3,071 for identical or similar assets or liabilities in inactive mar- Third quarter 3.281 0.57 3,117 kets, or other inputs that are observable or can be corrobo- Second quarter 0.57 2,988 0.52 2.879 rated by observable market data for substantially the full First quarter term of the assets or liabilities. Total cash dividends Level 3-Inputs that are generally unobservable and typically declared and paid $ 12,5635 2.18 $ 11,965 reflect management's estimate of assumptions that market participants would use in pricing the asset or liability. Segment Information and Geographic Data The Company's valuation techniques used to measure the fair value of money market funds and certain marketable Net sales by product (mil.) 2017 2016 2015 equity securities were derived from quoted prices in active $141,319 $136.700 $155,041 markets for identical assets or liabilities. The valuation 19,222 23,227 techniques used to measure the fair value of the Company's debt instruments and all other financial instruments, all of 25,850 22,831 25,471 which have counterparties with high credit ratings, were 29,980 24,348 19,999 valued based on quoted market prices or model-driven val- Other Products 12.863 11.132 10,067 uations using significant inputs derived from or corrobo- $229,234 $215.639 $233,715 rated by observable market data. In accordance with the fair value accounting require- Reportable segment (mil.) 2017 2015 ments, companies may choose to measure eligible financial instruments and certain other items at fair value. The $96,600 $ 86,613 $ 93,864 Company has not elected the fair value option for any eli- Operating income $30,684 $ 28,172 $ 31,186 gible financial instruments. Europe: Accrued Warranty and Indemnification Net sales $54,938 $ 49,952 $ 50,337 The following table shows changes in the Company's ac- Operating income $16,514 $ $ $ 16,527 crued warranties and related costs for 2017 and 2016: Greater China: Net sales $ 48,492 $ 58,715 $ millions $ 2017 2016 Operating income $17,032 $ 18,835 $ 23,002 Beginning accrued warranty and related costs $ 3,702 $ 4,780 Japan: Cost of warranty claims (4,322) (4.663) Net sales $17.733 $ 16,928 S 15,706 Accruals for product warranty 4,454 3,585 Operating income $ 8,097 $ 7,165 $ 7,617 Ending accrued warranty and related costs $ 3,702 Rest of Asia Pacific: $15,199 $ 13,654 $ 15,093 Term Debt Operating income $ 5,304 $ 4,781 $ 5,518 As of September 30, 2017, the Company had outstanding floating and fixed-rate notes with varying maturities for an A reconciliation of the Company's segment operating in- come to the Consolidated Statements of Operations for aggregate principal amount of $104.0 billion (collectively 2017, 2016 and 2015 is as follows: the "Notes"). The Notes are senior unsecured obligations, and interest is payable in arrears. $ millions The Company recognized S2.2 billion, $1.4 billion and 2017 Segment operating income $ $ 74,301 $83,850 $722 million of interest expense on its term debt for 2017, 2016 and 2015, respectively. Research and development As of September 30, 2017 and September 24, 2016, the (8,067) Other corporate expenses, net (4,706) (4,232) (4,553) fair value of the Company's Notes, based on Level 2 inputs, was $106.1 billion and $81.7 billion, respectively, Total operating income $ 61 344 $ 60,024 $71,230 $ 15,348 $44.764 $ 3.834 Net sales 2016 2015 $ 77,631 expense (11.581) (10,045) wiL47856_appA A1-A17.indd 9/19/18 12:58 PM FINAL PAGES aptara EOA A-10 Appendix A. Financial Statement Information Google Inc. (Alphabet Inc.) CONSOLIDATED BALANCE SHEETS (In millions, except share and par value amounts which are reflected in thousands, and par value per share amounts) As of As of December 31, 2017 December 31, 2016 Assets Current assets S 12,918 S 10,715 91,156 73,415 Cash and cash equivalents Marketable securities Total cash, cash equivalents, and marketable securities Accounts receivable, net of allowance of $467 and $674 Income taxes receivable, net Inventory 86,333 14,137 101,871 18,336 95 369 268 749 Other current assets 4,575 105,408 2,983 124,308 Total current assets Non-marketable investments Deferred income taxes 5.878 7,813 383 680 Property and equipment, net Intangible assets, net Goodwill 34,234 3,307 42,383 2,692 16,468 Other non current assets 1,819 16,747 2,672 197,295 167,497 s Total assets Liabilities and Stockholders' Equity Current liabilities Accounts payable Accrued compensation and benefits Accrued expenses and other current liabilities S 2,041 S 3,137 GOOGLE 3.976 6,144 4,581 10,177 3,975 1,432 Accrued revenue share 2,942 Deferred revenue 1,099 881 Income taxes payable, net Total current liabilities 554 16,256 24,183 3,969 Long-term debt Deferred revenue, non-current 3,935 202 340 4,677 Income taxes payable, non-current Deferred income taxes 12,812 430 226 2,665 Other long-term liabilities Total liabilities 3,059 44,793 28,461 0 0 Commitments and contingencies Stockholders' equity Convertible preferred stock, 50.001 par value per share, 100.000 shares authorized; no shares issued and outstanding Class A and Class B common stock, and Class C capital stock and additional paid-in capital, $0.001 par value per share: 15,000,000 shares authorized (Class A 9,000,000, Class B 3,000,000, Class C 3,000,000); 691,293 (Class A 296,992, Class B 47,437, Class C 346,864) and 694,783 (Class A 298,470, Class B 46,972, Class C 349,341) shares issued and outstanding Accumulated other comprehensive loss Retained earnings Total stockholders' equity Total liabilities and stockholders' equity 36,307 40,247 (2,402) 105.131 (992) 113.247 139,036 167.497 152,502 197.295 s $ Google is part of Alphabet, but we loosely refer to Alphabet as "Google" because of its global familiarity and that Google provides 99% of Alphabet's $110,855 billion in revenues. See accompanying notes. wiL47856 appA A1-A17 indd 10 8/19/18 12:58 PM EQA Appendix A. Financial Statement Information A-11 Google Inc. (Alphabet Inc.) CONSOLIDATED STATEMENTS OF INCOME (In millions) Year Ended December 31 2016 2017 2015 74,989 S $ 90.272 s 110,855 Revenues Costs and expenses Cost of revenues 28,164 12.282 35,138 13,948 45,583 16,625 12.893 9,047 6.136 10,485 6,985 6,872 0 0 55,629 19.360 2.736 84,709 Research and development Sales and marketing General and administrative European Commission fine Total costs and expenses Income from operations Other income (expense), net Income before income taxes Provision for income taxes Net income 66,556 23,716 26,146 291 434 1,047 27,193 24,150 4,672 14,531 19,651 3,303 16.348 522 S $ 19.478 $ 12.662 0 0 Less: Adjustment Payment to Class C capital stockholders Net income available to all stockholders 15.820 $ 19,478 S 12,662 'Google is part of Alphabet, but we loosely refer to Alphabet as "Google" because of its global familiarity and that Google provides 99% of Alphabet's $110,855 billion in revenues. See accompanying notes Google Inc. (Alphabet Inc.) CONSOLIDATED STATEMENTS OF COMPREHENSIVE INCOME GOOGLE (In millions) Year Ended December 31 2016 2017 2015 16,348 s 19,478 $ 12,662 (1.067) (599) 1,543 307 (715) 208 (314) 221 105 Net income Other comprehensive income (loss): Change in foreign currency translation adjustment Available for sale investments: Change in net unrealized gains (losses) Less: reclassification adjustment for net (gains) losses included in net income Net change (net of tax effect of S29, 50, and $0) Cash flow hedges: Change in net unrealized gains (losses) Less: reclassification adjustment for net (gains) losses included in net income Net change (net of tax effect of SIIS, 564, and $247) Other comprehensive income (loss) Comprehensive income (507) (93) 412 676 SIS (638) (351) 93 (1,003) (327) (1,901) 164 (545) 1.410 (528) 14,447 18,950 $ 14,072 "Google is part of Alphabet, but we loosely refer to Alphabet as "Google" because of its global familiarity and that Google provides 99% of Alphabet's $110,855 billion in revenues. See accompanying notes WIL47856 appA A1-A17.indd 11 o 9/19/18 12:58 PM FINAL PAGES aptara EQA A-12 Appendix A Financial Statement Information Google Inc. (Alphabet Inc.) CONSOLIDATED STATEMENTS OF STOCKHOLDERS' EQUITY (In millions, except share amounts which are reflected in thousands) Class A and Class B Total Common Stock. Class C Accumulated Capital Stock and Other Additional Paid-In Capital Comprehensive Shares Amount Income (Loss) 680,172 S 28,767 S 27 s 8,714 664 0 Retained Earnings Stockholders Equity 103,860 664 Balance as of December 31, 2014 75,066 0 0 0 0 5,151 815 5,151 815 0 0 0 0 0 0 Common and capital stock issued Stock-based compensation expense Stock-based compensation tax benefits Tax withholding related to vesting of restricted stock units Repurchases of capital stock Adjustment Payment to Class C capital stockholders Net income Other comprehensive loss Balance as of December 31, 2015 (2,779) (111) (2,779) (1,780) (2,391) 0 (1,669) 475 0 853 0 (522) 16,348 (47) 16,348 0 0 0 0 687,348 0 32,982 (1,901 (1,874) 89,223 (1,901) 120,331 0 180 0 47 (133) 0 9,106 298 0 298 0 6,700 0 0 6,700 (3,597) 0 (3,597) 0 0 Cumulative effect of accounting change Common and capital stock issued Stock-based compensation expense Tax withholding related to vesting of restricted stock units Repurchases of capital stock Net income Other comprehensive loss Balance as of December 31, 2016 (256) 0 (5,161) 0 (3,437) 19,478 (3,693) 19,478 0 0 0 0 0 36,307 (528 (2,402) (528) 139,036 691,293 105,131 GOOGLE 0 0 0 (15) (15) 212 8,652 212 0 0 0 7,694 0 0 7,694 0 (4,373) 0 0 Cumulative effect of accounting change Common and capital stock issued Stock-based compensation expense Tax withholding related to vesting of restricted stock units Repurchases of capital stock Sale of subsidiary shares Net income Other comprehensive loss Balance as of December 31, 2017 0 (4.531) (5,162) ( 0 (315) 722 (4,373) (4,846) ( 722 0 0 0 0 0 12,662 0 12,662 1.410 0 0 1,410 694,783 $ 40,247 $ (992) S 113,247 S 152,502 "Google is part of Alphabet, but we loosely refer to Alphabet as "Google" because of its global familiarity and that Google provides 99% of Alphabet's $110,855 billion in revenues. See accompanying notes. EQA Appendix A Financial Statement information A-13 Google Inc. (Alphabet Inc.) CONSOLIDATED STATEMENTS OF CASH FLOWS (In millions) Year Ended December 31 2015 2016 2017 Operating activities Net income 16,348 $ 19,478 $ 12,662 4,132 5.267 6,103 931 877 812 Adjustments: Depreciation and impairment of property and equipment Amortization and impairment of intangible assets Stock-based compensation expense Deferred income taxes Loss on marketable and non-marketable investments, net 5,203 6,703 7,679 258 (179) 334 (38) 275 194 Other 212 174 137 Changes in assets and liabilities, net of effects of acquisitions: Accounts receivable (2,094) (2,578) 3,125 Income taxes, net (179) (3,768) 8,211 (2,164) 731 312 (318) 203 110 1.597 1.515 4,891 339 593 955 43 390 223 36,036 26,572 37,091 (9.950) (10.212) (13,184) 35 99 (74,368) (92,195) 240 (84,509) 66,895 (1,109) 62,905 (2,326) 73,959 (1,745) O GOOGLE 154 533 494 (2,428) (350) 0 425 450 Other assets Accounts payable Accrued expenses and other liabilities Accrued revenue share Deferred revenue Net cash provided by operating activities Investing activities Purchases of property and equipment Proceeds from disposals of property and equipment Purchases of marketable securities Maturities and sales of marketable securities Purchases of non-marketable investments Maturities and sales of non-marketable investments Cash collateral related to securities lending Investments in reverse repurchase agreements Acquisitions, net of cash acquired, and purchases of intangible assets Proceeds from collection of notes receivable Net cash used in investing activities Financing activities Net payments related to stock-based award activities Adjustment Payment to Class C capital stockholders Repurchases of capital stock Proceeds from issuance of debt, net of costs Repayments of debt Proceeds from sale of subsidiary shares Net cash used in financing activities Effect of exchange rate changes on cash and cash equivalents Net decrease in cash and cash equivalents Cash and cash equivalents at beginning of period Cash and cash equivalents at end of period 0 (236) (986) (287) 0 0 1,419 (23.711) (31,165) (31,401) (2.375) (3,304) (4.166) D 0 (47) (1.780) (3.693) (4.846) 13.705 (13,728) 8,729 (10,064) 4,291 (4,377) 800 (8,298) 0 (8,332) 0 (4,225) (434) (1,798) (170) 405 (3,631) 18,347 16,549 12,918 (2,203) 12,918 10,715 16,549 s $ Supplemental disclosures of cash flow information Cash paid for taxes, net of refunds Cash paid for interest, net of amounts capitalized $ 3.651 S 1.643 S 6,191 S 96 S 84 s 84 Google is part of Alphabet, but we loosely refer to Alphabet as "Google" because of its global familiarity and that Google provides 99% of Alphabet's $110,855 billion in revenues. See accompanying notes wiL47856_AppA A1-A17.indd 13 9/19/18 12:58 PM
Step by Step Solution
There are 3 Steps involved in it

Get step-by-step solutions from verified subject matter experts