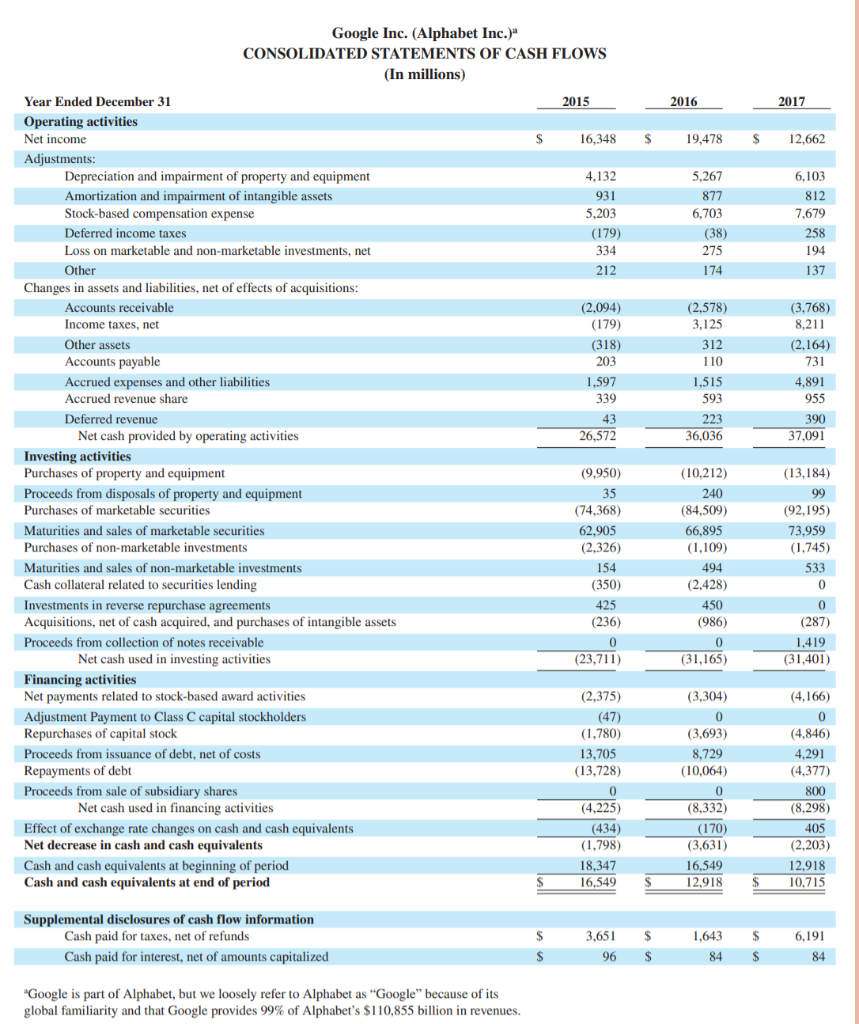
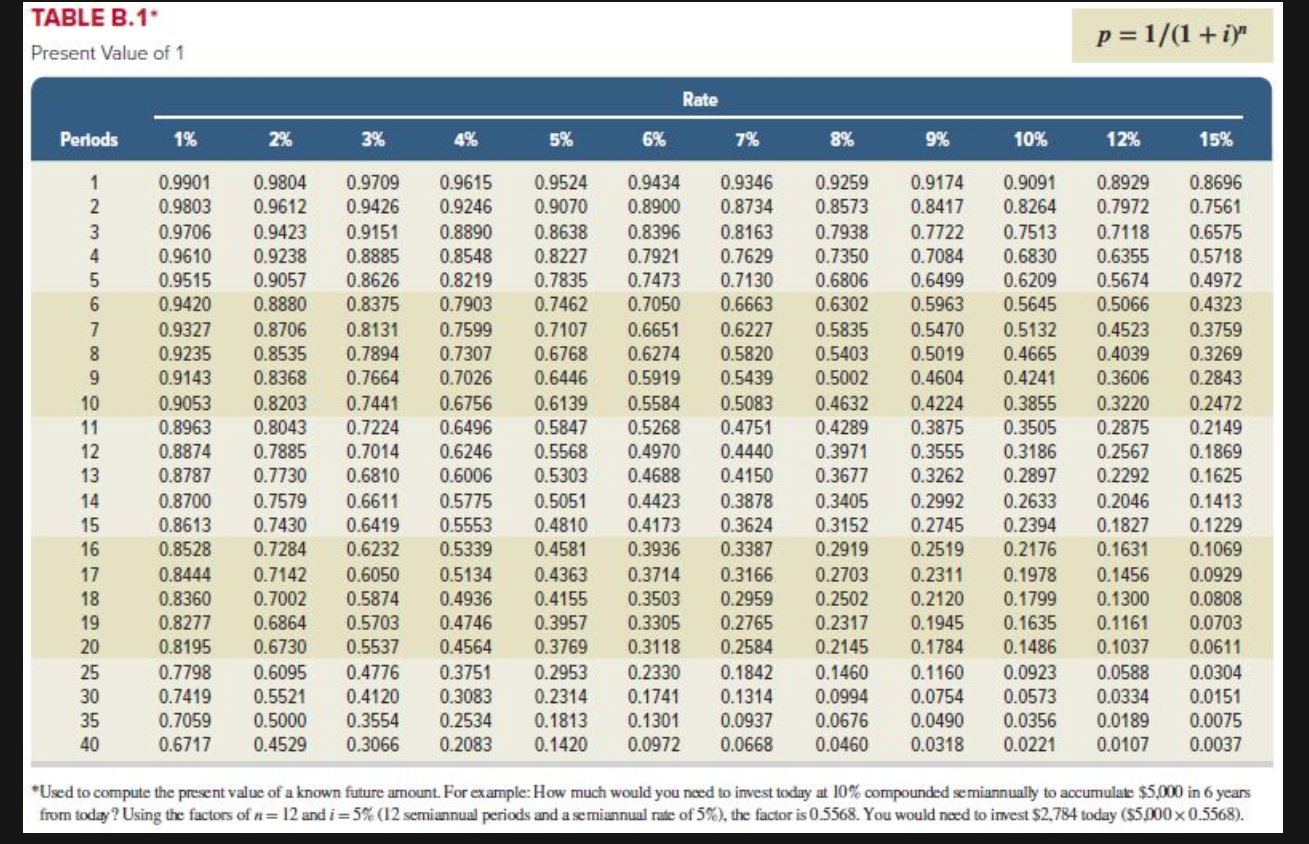
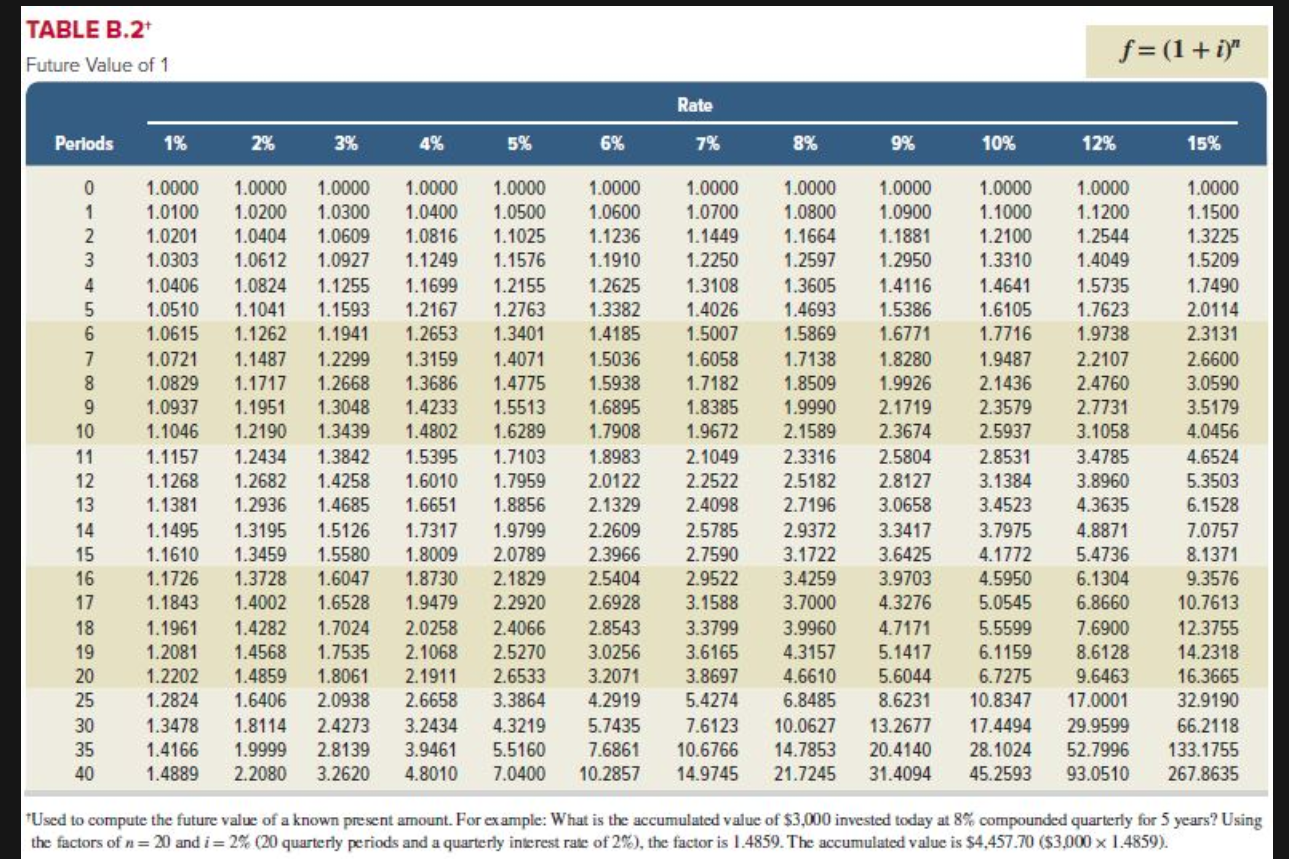
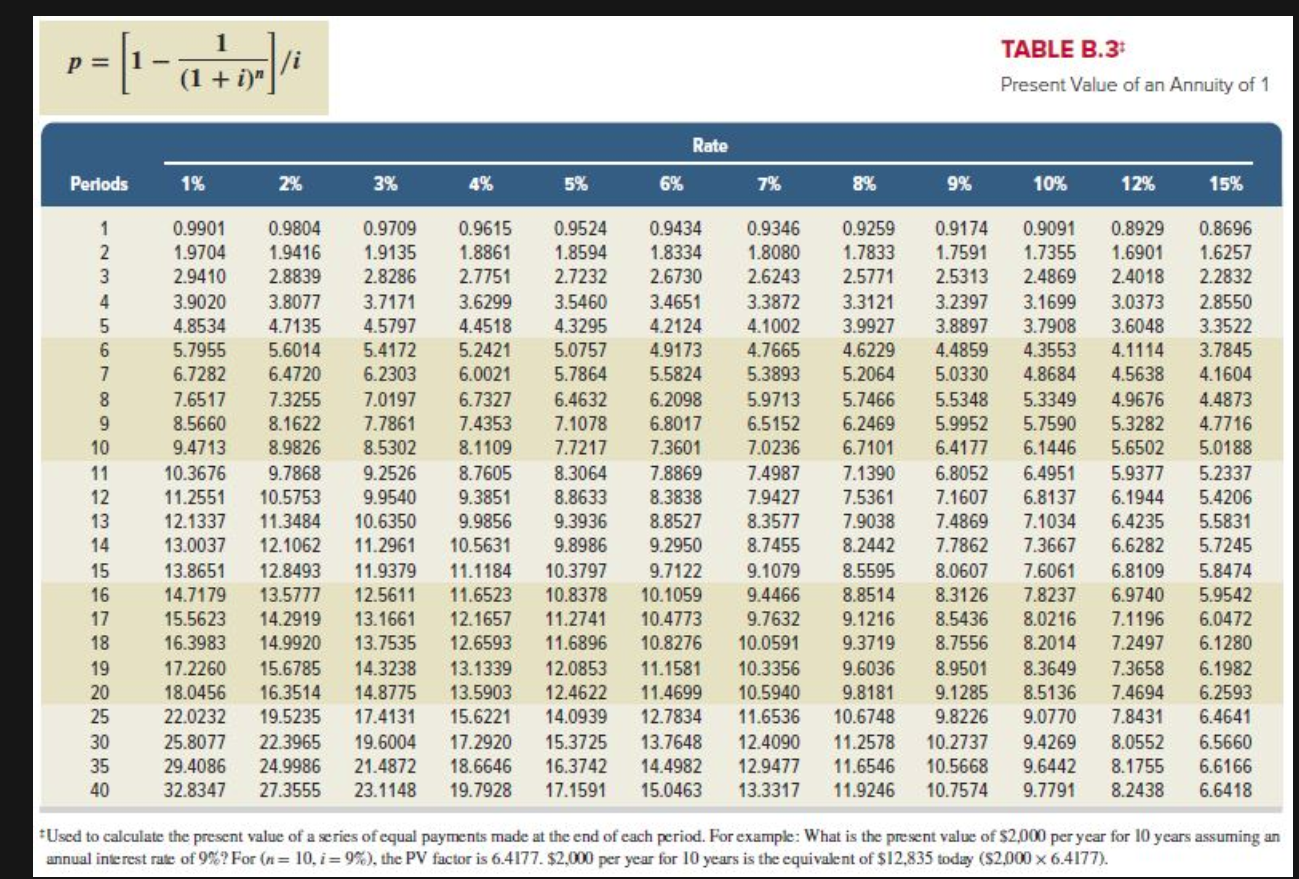
Assume that Google invests $2.42 billion in capital expenditures, including $1.08 billion related to manufacturing capacity. Assume that these projects have a seven-year life and that management requires a 15% internal rate of return on those projects. (PV of $1, FV of $1, PVA of $1, and FVA of $1) (Use appropriate factor(s) from the tables provided.) Required 1. What is the amount of annual cash flows that Google must earn from those expenditures to achieve a 15% internal rate of return? (Hint: Identify the seven-period, 15% factor from the present value of an annuity table and then divide $1.08 billion by the factor to get the annual cash flows required.) 2. Refer to the financial statements in Appendix A. Identify the amount that Google invested in capital assets for the year ended December 31, 2017.
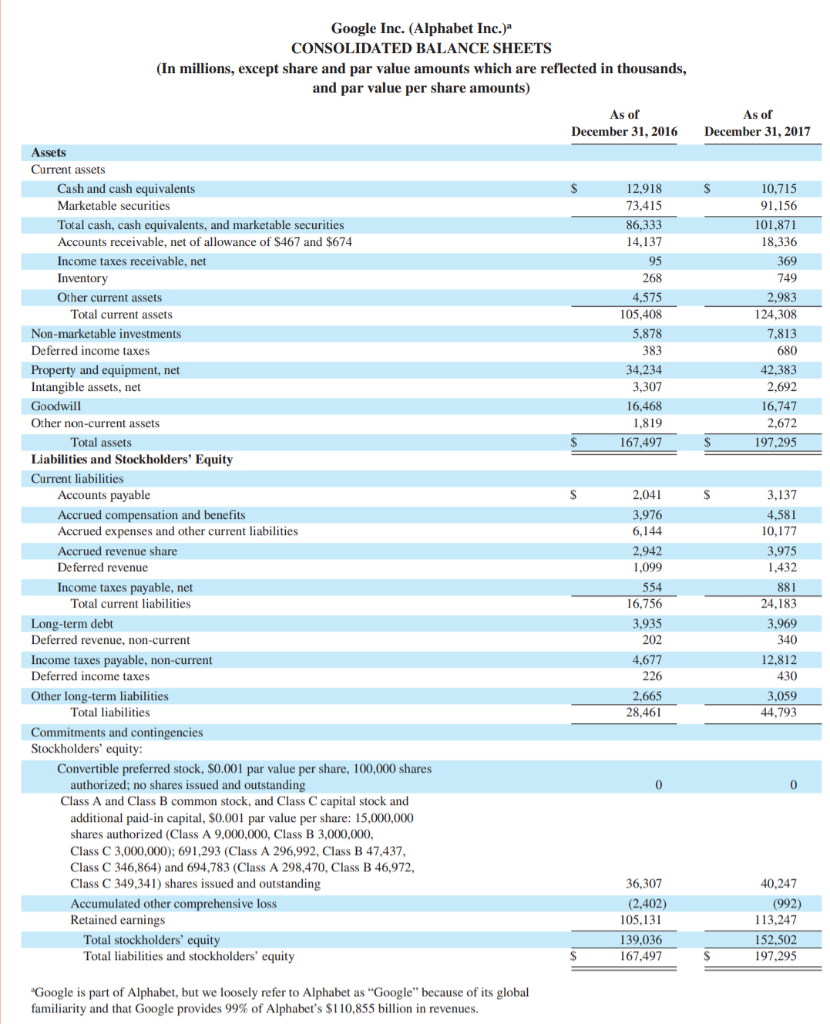
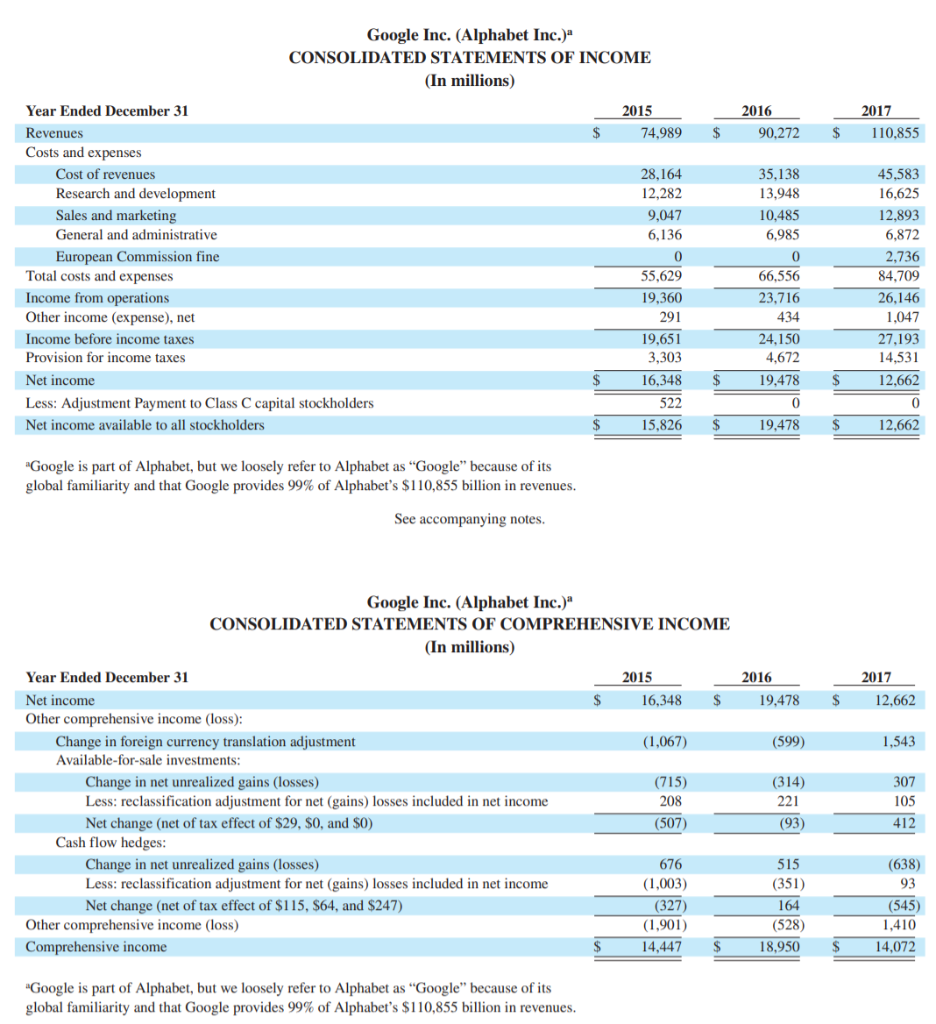
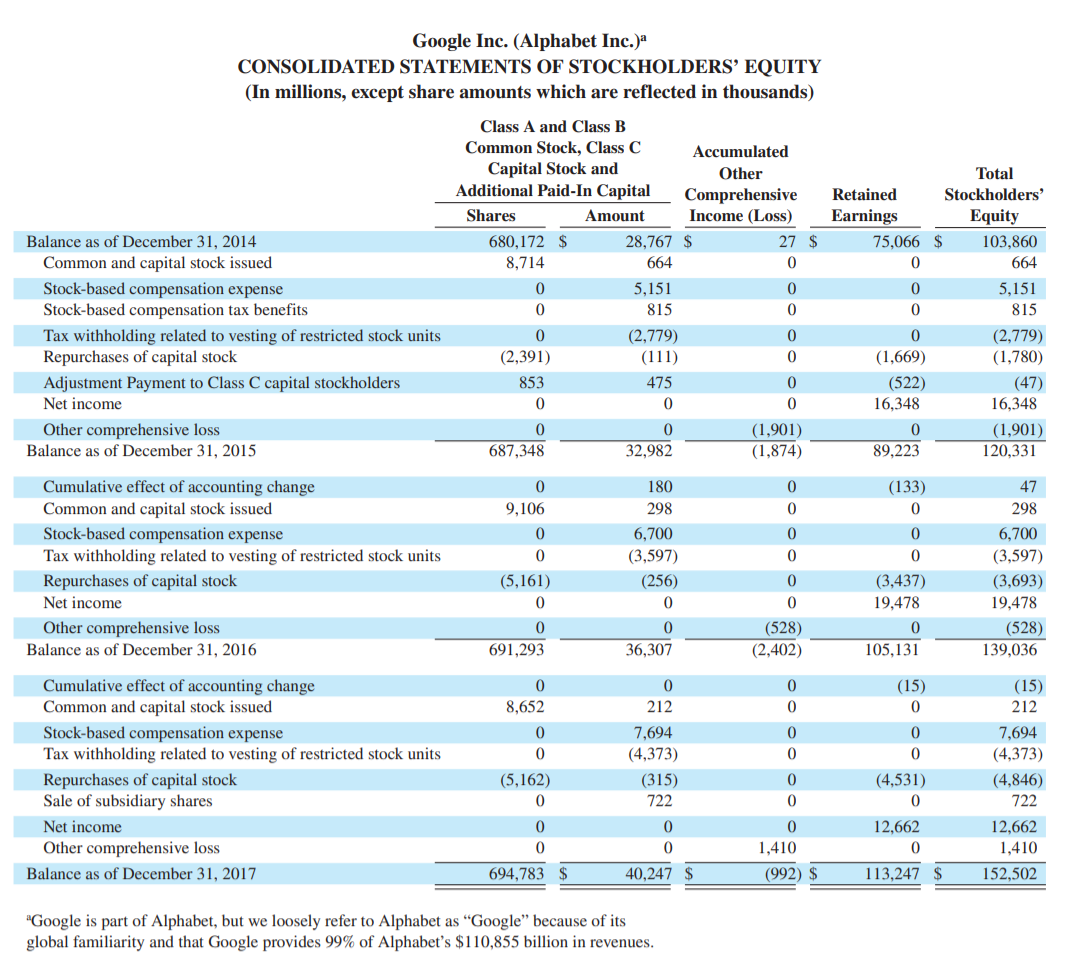
Google Inc. (Alphabet Inc.) CONSOLIDATED BALANCE SHEETS (In millions, except share and par value amounts which are reflected in thousands, and par value per share amounts) As of December 31, 2016 As of December 31, 2017 12,918 73.415 86,333 14,137 95 268 4,575 105,408 5,878 383 34,234 3,307 16,468 1,819 167,497 10,715 91.156 101,871 18,336 369 749 2,983 124,308 7.813 680 42,383 2,692 16,747 2,672 197,295 S S 2.041 3,976 6,144 Assets Current assets Cash and cash equivalents Marketable securities Total cash, cash equivalents, and marketable securities Accounts receivable, net of allowance of $467 and $674 Income taxes receivable, net Inventory Other current assets Total current assets Non-marketable investments Deferred income taxes Property and equipment, net Intangible assets, net Goodwill Other non-current assets Total assets Liabilities and Stockholders' Equity Current liabilities Accounts payable Accrued compensation and benefits Accrued expenses and other current liabilities Accrued revenue share Deferred revenue Income taxes payable, net Total current liabilities Long-term debt Deferred revenue, non-current Income taxes payable, non-current Deferred income taxes Other long-term liabilities Total liabilities Commitments and contingencies Stockholders' equity: Convertible preferred stock, $0.001 par value per share, 100,000 shares authorized; no shares issued and outstanding Class A and Class B common stock, and Class C capital stock and additional paid-in capital, $0.001 par value per share: 15,000,000 shares authorized (Class A 9,000,000, Class B 3,000,000, Class C 3,000,000): 691,293 (Class A 296,992, Class B 47,437, Class C 346,864) and 694,783 (Class A 298,470, Class B 46,972, Class C 349,341) shares issued and outstanding Accumulated other comprehensive loss Retained earnings Total stockholders' equity Total liabilities and stockholders' equity 2,942 1,099 554 16,756 3,137 4,581 10.177 3,975 1,432 881 24,183 3,969 340 12.812 430 3,059 44,793 3,935 202 4,677 226 2,665 28,461 0 0 36,307 (2,402) 105,131 139,036 167,497 40,247 (992) 113,247 152.502 197,295 "Google is part of Alphabet, but we loosely refer to Alphabet as "Google" because of its global familiarity and that Google provides 99% of Alphabet's $110,855 billion in revenues. Google Inc. (Alphabet Inc.) CONSOLIDATED STATEMENTS OF INCOME (In millions) 2015 74,989 2016 90.272 2017 110,855 28.164 12,282 9,047 6,136 Year Ended December 31 Revenues Costs and expenses Cost of revenues Research and development Sales and marketing General and administrative European Commission fine Total costs and expenses Income from operations Other income (expense), net Income before income taxes Provision for income taxes Net income Less: Adjustment Payment to Class C capital stockholders Net income available to all stockholders 55,629 19,360 291 19,651 3,303 16,348 522 15.826 35,138 13.948 10,485 6,985 0 66,556 23,716 434 24.150 4,672 19,478 45,583 16,625 12,893 6,872 2,736 84,709 26,146 1.047 27,193 14,531 12,662 $ 0 0 $ 19,478 12.662 "Google is part of Alphabet, but we loosely refer to Alphabet as "Google" because of its global familiarity and that Google provides 99% of Alphabet's $110,855 billion in revenues. See accompanying notes. 2016 2017 19,478 12,662 (599) 1,543 Google Inc. (Alphabet Inc.) CONSOLIDATED STATEMENTS OF COMPREHENSIVE INCOME (In millions) Year Ended December 31 2015 Net income 16,348 Other comprehensive income (loss): Change in foreign currency translation adjustment (1,067) Available-for-sale investments: Change in net unrealized gains (losses) (715) Less: reclassification adjustment for net (gains) losses included in net income 208 Net change (net of tax effect of $29, $0, and $0) (507) Cash flow hedges: Change in net unrealized gains (losses) 676 Less: reclassification adjustment for net (gains) losses included in net income (1,003) Net change (net of tax effect of $115, $64, and $247) (327) Other comprehensive income (loss) (1,901) Comprehensive income $ 14,447 (314) 221 (93) 307 105 412 515 (351) 164 (528) 18,950 (638) 93 (545) 1,410 14,072 "Google is part of Alphabet, but we loosely refer to Alphabet as "Google" because of its global familiarity and that Google provides 99% of Alphabet's $110,855 billion in revenues. Google Inc. (Alphabet Inc.)a CONSOLIDATED STATEMENTS OF STOCKHOLDERS' EQUITY (In millions, except share amounts which are reflected in thousands) Balance as of December 31, 2014 Common and capital stock issued Stock-based compensation expense Stock-based compensation tax benefits Tax withholding related to vesting of restricted stock units Repurchases of capital stock Adjustment Payment to Class C capital stockholders Net income Other comprehensive loss Balance as of December 31, 2015 Class A and Class B Common Stock, Class C Accumulated Capital Stock and Other Additional Paid-In Capital Comprehensive Shares Amount Income (Loss) 680,172 $ 28,767 $ 27 $ 8,714 664 0 0 5,151 0 0 815 0 0 (2,779) 0 (2,391) (111) 0 853 475 0 0 0 0 0 0 (1,901) 687,348 32,982 (1,874) Total Retained Stockholders' Earnings Equity 75,066 $ 103,860 0 664 0 5,151 0 815 0 (2,779) (1,669) (1,780) (522) (47) 16,348 16,348 0 (1,901) 89,223 120,331 0 Cumulative effect of accounting change Common and capital stock issued Stock-based compensation expense Tax withholding related to vesting of restricted stock units Repurchases of capital stock Net income Other comprehensive loss Balance as of December 31, 2016 0 9,106 0 0 (5,161) 0 180 298 6,700 (3,597) (256) 0 0 0 0 0 (133) 0 0 0 (3,437) 19,478 47 298 6,700 (3,597) (3,693) 19,478 (528) 139,036 0 0 691,293 0 36,307 (528) (2,402) 0 105,131 0 0 0 8,652 (15) 0 0 0 0 0 212 7,694 (4,373) (315) 722 Cumulative effect of accounting change Common and capital stock issued Stock-based compensation expense Tax withholding related to vesting of restricted stock units Repurchases of capital stock Sale of subsidiary shares Net income Other comprehensive loss Balance as of December 31, 2017 0 0 (5,162) 0 0 0 (4,531) 0 (15) 212 7,694 (4,373) (4,846) 722 12,662 1,410 152,502 0 0 0 0 0 1,410 (992) $ 12,662 0 694,783 $ 40,247 $ 113,247 $ "Google is part of Alphabet, but we loosely refer to Alphabet as Google because of its global familiarity and that Google provides 99% of Alphabet's $110,855 billion in revenues. 2016 2017 S 19.478 s 12,662 5,267 877 6,703 (38) 275 6,103 812 7,679 258 194 137 174 (2.578) 3,125 312 110 1,515 593 223 36,036 (3,768) 8,211 (2,164) 731 4,891 955 390 37,091 Google Inc. (Alphabet Inc.) CONSOLIDATED STATEMENTS OF CASH FLOWS (In millions) Year Ended December 31 2015 Operating activities Net income S 16.348 Adjustments: Depreciation and impairment of property and equipment 4,132 Amortization and impairment of intangible assets 931 Stock-based compensation expense 5.203 Deferred income taxes (179) Loss on marketable and non-marketable investments, net 334 Other 212 Changes in assets and liabilities, net of effects of acquisitions: Accounts receivable (2,094) Income taxes, net (179) Other assets (318) Accounts payable 203 Accrued expenses and other liabilities 1,597 Accrued revenue share 339 Deferred revenue 43 Net cash provided by operating activities 26,572 Investing activities Purchases of property and equipment (9.950) Proceeds from disposals of property and equipment 35 Purchases of marketable securities (74,368) Maturities and sales of marketable securities 62.905 Purchases of non-marketable investments (2.326) Maturities and sales of non-marketable investments 154 Cash collateral related to securities lending (350) Investments in reverse repurchase agreements 425 Acquisitions, net of cash acquired, and purchases of intangible assets (236) Proceeds from collection of notes receivable 0 Net cash used in investing activities (23,711) Financing activities Net payments related to stock-based award activities (2,375) Adjustment Payment to Class C capital stockholders (47) Repurchases of capital stock (1,780) Proceeds from issuance of debt, net of costs 13,705 Repayments of debt (13,728) Proceeds from sale of subsidiary shares 0 Net cash used in financing activities (4,225) Effect of exchange rate changes on cash and cash equivalents (434) Net decrease in cash and cash equivalents (1,798) Cash and cash equivalents at beginning of period 18,347 Cash and cash equivalents at end of period 16,549 (10,212) 240 (84,509) 66,895 (1,109) 494 (2,428) 450 (986) 0 (31,165) (13,184) 99 (92,195) 73.959 (1,745) 533 0 0 (287) 1,419 (31,401) (3,304) 0 (3,693) 8,729 (10,064) 0 (8,332) (4,166) 0 (4,846) 4.291 (4.377) 800 (8.298) 405 (2,203) 12,918 10,715 (170) (3,631) 16,549 12,918 S Supplemental disclosures of cash flow information Cash paid for taxes, net of refunds Cash paid for interest, net of amounts capitalized S $ 3,651 96 $ $ 1,643 84 6,191 84 S S "Google is part of Alphabet, but we loosely refer to Alphabet as "Google" because of its global familiarity and that Google provides 99% of Alphabet's $110,855 billion in revenues. TABLE B.1 p=1/(1 + i)" Present Value of 1 Rate Periods 1% 2% 3% 4% 5% 6% 7% 8% 9% 10% 12% 15% 1 2 3 4 5 8 9 10 11 12 13 14 15 16 17 18 19 20 25 30 35 40 0.9901 0.9803 0.9706 0.9610 0.9515 0.9420 0.9327 0.9235 0.9143 0.9053 0.8963 0.8874 0.8787 0.8700 0.8613 0.8528 0.8444 0.8360 0.8277 0.8195 0.7798 0.7419 0.7059 0.6717 0.9804 0.9612 0.9423 0.9238 0.9057 0.8880 0.8706 0.8535 0.8368 0.8203 0.8043 0.7885 0.7730 0.7579 0.7430 0.7284 0.7142 0.7002 0.6864 0.6730 0.6095 0.5521 0.5000 0.4529 0.9709 0.9426 0.9151 0.8885 0.8626 0.8375 0.8131 0.7894 0.7664 0.7441 0.7224 0.7014 0.6810 0.6611 0.6419 0.6232 0.6050 0.5874 0.5703 0.5537 0.4776 0.4120 0.3554 0.3066 0.9615 0.9246 0.8890 0.8548 0.8219 0.7903 0.7599 0.7307 0.7026 0.6756 0.6496 0.6246 0.6006 0.5775 0.5553 0.5339 0.5134 0.4936 0.4746 0.4564 0.3751 0.3083 0.2534 0.2083 0.9524 0.9070 0.8638 0.8227 0.7835 0.7462 0.7107 0.6768 0.6446 0.6139 0.5847 0.5568 0.5303 0.5051 0.4810 0.4581 0.4363 0.4155 0.3957 0.3769 0.2953 0.2314 0.1813 0.1420 0.9434 0.8900 0.8396 0.7921 0.7473 0.7050 0.6651 0.6274 0.5919 0.5584 0.5268 0.4970 0.4688 0.4423 0.4173 0.3936 0.3714 0.3503 0.3305 0.3118 0.2330 0.1741 0.1301 0.0972 0.9346 0.8734 0.8163 0.7629 0.7130 0.6663 0.6227 0.5820 0.5439 0.5083 0.4751 0.4440 0.4150 0.3878 0.3624 0.3387 0.3166 0.2959 0.2765 0.2584 0.1842 0.1314 0.0937 0.0668 0.9259 0.8573 0.7938 0.7350 0.6806 0.6302 0.5835 0.5403 0.5002 0.4632 0.4289 0.3971 0.3677 0.3405 0.3152 0.2919 0.2703 0.2502 0.2317 0.2145 0.1460 0.0994 0.0676 0.0460 0.9174 0.8417 0.7722 0.7084 0.6499 0.5963 0.5470 0.5019 0.4604 0.4224 0.3875 0.3555 0.3262 0.2992 0.2745 0.2519 0.2311 0.2120 0.1945 0.1784 0.1160 0.0754 0.0490 0.0318 0.9091 0.8264 0.7513 0.6830 0.6209 0.5645 0.5132 0.4665 0.4241 0.3855 0.3505 0.3186 0.2897 0.2633 0.2394 0.2176 0.1978 0.1799 0.1635 0.1486 0.0923 0.0573 0.0356 0.0221 0.8929 0.7972 0.7118 0.6355 0.5674 0.5066 0.4523 0.4039 0.3606 0.3220 0.2875 0.2567 0.2292 0.2046 0.1827 0.1631 0.1456 0.1300 0.1161 0.1037 0.0588 0.0334 0.0189 0.0107 0.8696 0.7561 0.6575 0.5718 0.4972 0.4323 0.3759 0.3269 0.2843 0.2472 0.2149 0.1869 0.1625 0.1413 0.1229 0.1069 0.0929 0.0808 0.0703 0.0611 0.0304 0.0151 0.0075 0.0037 *Used to compute the present value of a known future amount. For example: How much would you need to invest today at 10% compounded semiannually to accumulate $5,000 in 6 years from today? Using the factors of n= 12 and i=5% (12 semiannual periods and a semiannual rate of 5%), the factor is 0.5568. You would need to invest $2,784 today ($5.000 x 0.5568). TABLE B.2 Future Value of 1 f=(1 + i)" Rate Periods 1% 2% 3% 4% 5% 6% 7% 8% 9% 10% 12% 15% 0 1 2 3 4 5 6 7 8 9 10 11 12 13 14 15 16 17 18 19 20 25 30 35 40 1.0000 1.0100 1.0201 1.0303 1.0406 1.0510 1.0615 1.0721 1.0829 1.0937 1.1046 1.1157 1.1268 1.1381 1.1495 1.1610 1.1726 1.1843 1.1961 1.2081 1.2202 1.2824 1.3478 1.4166 1.4889 1.0000 1.0200 1.0404 1.0612 1.0824 1.1041 1.1262 1.1487 1.1717 1.1951 1.2190 1.2434 1.2682 1.2936 1.3195 1.3459 1.3728 1.4002 1.4282 1.4568 1.4859 1.6406 1.8114 1.0000 1.0300 1.0609 1.0927 1.1255 1.1593 1.1941 1.2299 1.2668 1.3048 1.3439 1.3842 1.4258 1.4685 1.5126 1.5580 1.6047 1.6528 1.7024 1.7535 1.8061 2.0938 2.4273 2.8139 3.2620 1.0000 1.0400 1.0816 1.1249 1.1699 1.2167 1.2653 1.3159 1.3686 1.4233 1.4802 1.5395 1.6010 1.6651 1.7317 1.8009 1.8730 1.9479 2.0258 2.1068 2.1911 2.6658 3.2434 3.9461 4.8010 1.0000 1.0500 1.1025 1.1576 1.2155 1.2763 1.3401 1.4071 1.4775 1.5513 1.6289 1.7103 1.7959 1.8856 1.9799 2.0789 2.1829 2.2920 2.4066 2.5270 2.6533 3.3864 4.3219 5.5160 7.0400 1.0000 1.0600 1.1236 1.1910 1.2625 1.3382 1.4185 1.5036 1.5938 1.6895 1.7908 1.8983 2.0122 2.1329 2.2609 2.3966 2.5404 2.6928 2.8543 3.0256 3.2071 4.2919 5.7435 7.6861 10.2857 1.0000 1.0700 1.1449 1.2250 1.3108 1.4026 1.5007 1.6058 1.7182 1.8385 1.9672 2.1049 2.2522 2.4098 2.5785 2.7590 2.9522 3.1588 3.3799 3.6165 3.8697 5.4274 7.6123 10.6766 14.9745 1.0000 1.0800 1.1664 1.2597 1.3605 1.4693 1.5869 1.7138 1.8509 1.9990 2.1589 2.3316 2.5182 2.7196 2.9372 3.1722 3.4259 3.7000 3.9960 4.3157 4.6610 6.8485 10.0627 14.7853 21.7245 1.0000 1.0900 1.1881 1.2950 1.4116 1.5386 1.6771 1.8280 1.9926 2.1719 2.3674 2.5804 2.8127 3.0658 3.3417 3.6425 3.9703 4.3276 4.7171 5.1417 5.6044 8.6231 13.2677 20.4140 31.4094 1.0000 1.1000 1.2100 1.3310 1.4641 1.6105 1.7716 1.9487 2.1436 2.3579 2.5937 2.8531 3.1384 3.4523 3.7975 4.1772 4.5950 5.0545 5.5599 6.1159 6.7275 10.8347 17.4494 28.1024 45.2593 1.0000 1.1200 1.2544 1.4049 1.5735 1.7623 1.9738 2.2107 2.4760 2.7731 3.1058 3.4785 3.8960 4.3635 4.8871 5.4736 6.1304 6.8660 7.6900 8.6128 9.6463 17.0001 29.9599 52.7996 93.0510 1.0000 1.1500 1.3225 1.5209 1.7490 2.0114 2.3131 2.6600 3.0590 3.5179 4.0456 4.6524 5.3503 6.1528 7.0757 8.1371 9.3576 10.7613 12.3755 14.2318 16.3665 32.9190 66.2118 133.1755 267.8635 1.9999 2.2080 *Used to compute the future value of a known present amount. For example: What is the accumulated value of $3,000 invested today at 8% compounded quarterly for 5 years? Using the factors of n= 20 and i = 2% (20 quarterly periods and a quarterly interest rate of 2%), the factor is 1.4859. The accumulated value is $4,457.70 ($3,000 x 1.4859). p = =[-a top (1 + i)" TABLE B.3 Present Value of an Annuity of 1 Rate Periods 1% 2% 3% 4% 5% 6% 7% 8% 9% 10% 12% 15% 1 2 3 4 5 6 7 8 9 10 11 12 13 14 15 16 17 18 19 20 25 30 35 40 0.9901 1.9704 2.9410 3.9020 4.8534 5.7955 6.7282 7.6517 8.5660 9.4713 10.3676 11.2551 12.1337 13.0037 13.8651 14.7179 15.5623 16.3983 17.2260 18.0456 22.0232 25.8077 29.4086 32.8347 0.9804 1.9416 2.8839 3.8077 4.7135 5.6014 6.4720 7.3255 8.1622 8.9826 9.7868 10.5753 11.3484 12.1062 12.8493 13.5777 14.2919 14.9920 15.6785 16.3514 19.5235 22.3965 24.9986 27.3555 0.9709 1.9135 2.8286 3.7171 4.5797 5.4172 6.2303 7.0197 7.7861 8.5302 9.2526 9.9540 10.6350 11.2961 11.9379 12.5611 13.1661 13.7535 14.3238 14.8775 17.4131 19.6004 21.4872 23.1148 0.9615 1.8861 2.7751 3.6299 4.4518 5.2421 6.0021 6.7327 7.4353 8.1109 8.7605 9.3851 9.9856 10.5631 11.1184 11.6523 12.1657 12.6593 13.1339 13.5903 15.6221 17.2920 18.6646 19.7928 0.9524 1.8594 2.7232 3.5460 4.3295 5.0757 5.7864 6.4632 7.1078 7.7217 8.3064 8.8633 9.3936 9.8986 10.3797 10.8378 11.2741 11.6896 12.0853 12.4622 14.0939 15.3725 16.3742 17.1591 0.9434 1.8334 2.6730 3.4651 4.2124 4.9173 5.5824 6.2098 6.8017 7.3601 7.8869 8.3838 8.8527 9.2950 9.7122 10.1059 10.4773 10.8276 11.1581 11.4699 12.7834 13.7648 14.4982 15.0463 0.9346 1.8080 2.6243 3.3872 4.1002 4.7665 5.3893 5.9713 6.5152 7.0236 7.4987 7.9427 8.3577 8.7455 9.1079 9.4466 9.7632 10.0591 10.3356 10.5940 11.6536 12.4090 12.9477 13.3317 0.9259 1.7833 2.5771 3.3121 3.9927 4.6229 5.2064 5.7466 6.2469 6.7101 7.1390 7.5361 7.9038 8.2442 8.5595 8.8514 9.1216 9.3719 9.6036 9.8181 10.6748 11.2578 11.6546 11.9246 0.9174 1.7591 2.5313 3.2397 3.8897 4.4859 5.0330 5.5348 5.9952 6.4177 6.8052 7.1607 7.4869 7.7862 8.0607 8.3126 8.5436 8.7556 8.9501 9.1285 9.8226 10.2737 10.5668 10.7574 0.9091 1.7355 2.4869 3.1699 3.7908 4.3553 4.8684 5.3349 5.7590 6.1446 6.4951 6.8137 7.1034 7.3667 7.6061 7.8237 8.0216 8.2014 8.3649 8.5136 9.0770 9.4269 9.6442 9.7791 0.8929 1.6901 2.4018 3.0373 3.6048 4.1114 4.5638 4.9676 5.3282 5.6502 5.9377 6.1944 6.4235 6.6282 6.8109 6.9740 7.1196 7.2497 7.3658 7.4694 7.8431 8.0552 8.1755 8.2438 0.8696 1.6257 2.2832 2.8550 3.3522 3.7845 4.1604 4.4873 4.7716 5.0188 5.2337 5.4206 5.5831 5.7245 5.8474 5.9542 6.0472 6.1280 6.1982 6.2593 6.4641 6.5660 6.6166 6.6418 Used to calculate the present value of a series of equal payments made at the end of each period. For example: What is the present value of $2,000 per year for 10 years assuming an annual interest rate of 9%? For (n= 10,i=9%), the PV factor is 6.4177. $2,000 per year for 10 years is the equivalent of $12,835 today ($2,000 X 6.4177). TABLE B.4% f=[(1 + i)" 1]/i Future Value of an Annuity of 1 Rate Periods 1% 2% 3% 5% 6% 7% 8% 9% 10% 12% 15% 1 2. 3 4 5 6 7 8 9 10 11 12 13 14 15 16 17 18 19 20 25 30 35 40 1.0000 2.0100 3.0301 4.0604 5.1010 6.1520 7.2135 8.2857 9.3685 10.4622 11.5668 12.6825 13.8093 14.9474 16.0969 17.2579 18.4304 19.6147 20.8109 22.0190 28.2432 34.7849 41.6603 48.8864 1.0000 2.0200 3.0604 4.1216 5.2040 6.3081 7.4343 8.5830 9.7546 10.9497 12.1687 13.4121 14.6803 15.9739 17.2934 18.6393 20.0121 21.4123 22.8406 24.2974 32.0303 40.5681 49.9945 60.4020 1.0000 2.0300 3.0909 4.1836 5.3091 6.4684 7.6625 8.8923 10.1591 11.4639 12.8078 14.1920 15.6178 17.0863 18.5989 20.1569 21.7616 23.4144 25.1169 26.8704 36.4593 47.5754 60.4621 75.4013 1.0000 1.0000 2.0400 2.0500 3.1216 3.1525 4.2465 4.3101 5.4163 5.5256 6.6330 6.8019 7.8983 8.1420 9.2142 9.5491 10.5828 11.0266 12.0061 12.5779 13.4864 14.2068 15.0258 15.9171 16.6268 17.7130 18.2919 19.5986 20.0236 21.5786 21.8245 23.6575 23.6975 25.8404 25.6454 28.1324 27.6712 30.5390 29.7781 33.0660 41.6459 47.7271 56.0849 66.4388 73.6522 90.3203 95.0255 120.7998 1.0000 2.0600 3.1836 4.3746 5.6371 6.9753 8.3938 9.8975 11.4913 13.1808 14.9716 16.8699 18.8821 21.0151 23.2760 25.6725 28.2129 30.9057 33.7600 36.7856 54.8645 79.0582 111.4348 154.7620 1.0000 2.0700 3.2149 4.4399 5.7507 7.1533 8.6540 10.2598 11.9780 13.8164 15.7836 17.8885 20.1406 22.5505 25.1290 27.8881 30.8402 33.9990 37.3790 40.9955 63.2490 94.4608 138.2369 199.6351 1.0000 2.0800 3.2464 4.5061 5.8666 7.3359 8.9228 10.6366 12.4876 14.4866 16.6455 18.9771 21.4953 24.2149 27.1521 30.3243 33.7502 37.4502 41.4463 45.7620 73.1059 113.2832 172.3168 259.0565 1.0000 1.0000 1.0000 2.0900 2.1000 2.1200 3.2781 3.3100 3.3744 4.5731 4.6410 4.7793 5.9847 6.1051 6.3528 7.5233 7.7156 8.1152 9.2004 9.4872 10.0890 11.0285 11.4359 12.2997 13.0210 13.5795 14.7757 15.1929 15.9374 17.5487 17.5603 18.5312 20.6546 20.1407 21.3843 24.1331 22.9534 24.5227 28.0291 26.0192 27.9750 32.3926 29.3609 31.7725 37.2797 33.0034 35.9497 42.7533 36.9737 40.5447 48.8837 41.3013 45.5992 55.7497 46.0185 51.1591 63.4397 51.1601 57.2750 72.0524 84.7009 98.3471 133.3339 136.3075 164.4940241.3327 215.7108 271.0244 431.6635 337.8824 442.5926 767.0914 1.0000 2.1500 3.4725 4.9934 6.7424 8.7537 11.0668 13.7268 16.7858 20.3037 24.3493 29.0017 34.3519 40.5047 47.5804 55.7175 65.0751 75.8364 88.2118 102.4436 212.7930 434.7451 881.1702 1.779.0903 Used to calculate the future value of a series of equal payments made at the end of each period. For example: What is the future value of $4,000 per year for 6 years assuming an annual interest rate of 8%? For (n=6,i=8%), the FV factor is 7.3359. $4,000 per year for 6 years accumulates to $29,343.60 ($4,000 X 7.3359)