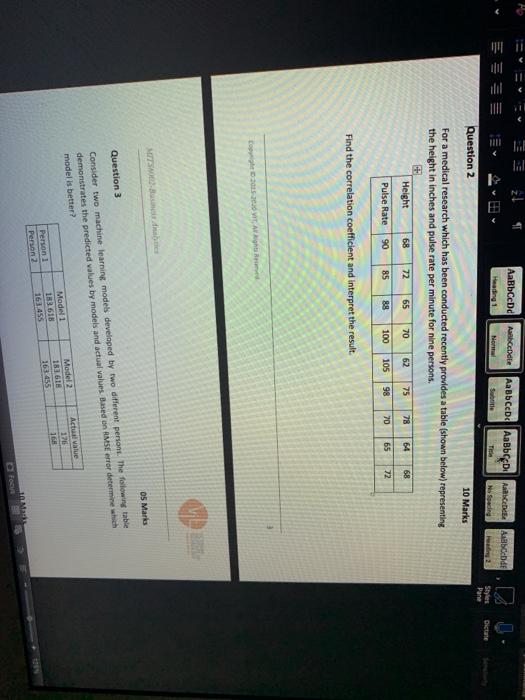
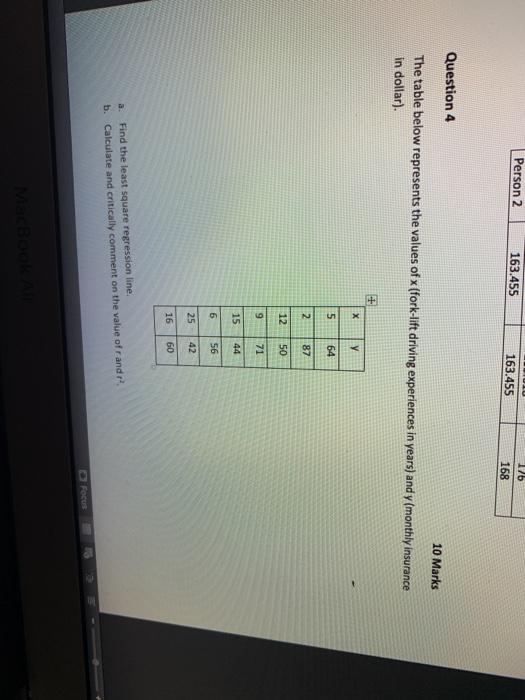
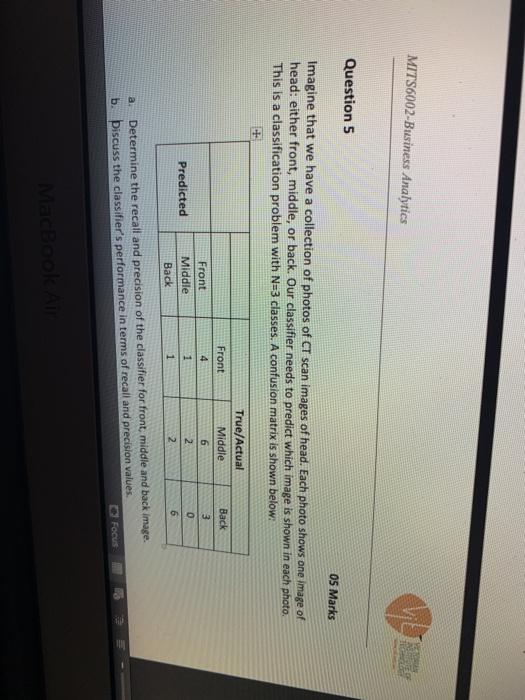
AaBbccdd Abendte AaBb CcDc AaBb DA EDGE Abede Headings No Site Styles Pane Question 2 10 Marks For a medical research which has been conducted recently provides a table (shown below) representing the height in inches and pulse rate per minute for nine persons Height 68 72 65 70 62 75 78 64 68 Pulse Rate 90 85 88 100 105 98 70 65 72 Find the correlation coefficient and interpret the result. 20 VITA OS Marks Question 3 Consider two machine learning models developed by two different person. The following table demonstrates the predicted values by models and actual values Based on RMS error determine which model is better? Actual value 120 Model 1 183 618 163 455 Model 2 1816 161655 Person Person 2 DF Person 2 163.455 163.455 16 168 Question 4 10 Marks The table below represents the values of x (fork-lift driving experiences in years) and y (monthly insurance in dollar) x 5 64 2 87 12 50 9 71 15 44 6 56 25 42 16 60 Find the least square regression line b. Calculate and critically comment on the value ofr andr MITS6002-Business Analytics Question 5 05 Marks Imagine that we have a collection of photos of CT scan images of head. Each photo shows one Image of head: either front, middle, or back. Our classifier needs to predict which image is shown in each photo. This is a classification problem with N=3 classes. A confusion matrix is shown below: True/Actual Middle 6 Back Front 4 1 1 Front Middle Back 2 3 0 6 Predicted 2 a Determine the recall and precision of the classifier for front, middle and back image. b. Discuss the classifier's performance in terms of recall and precision values. Focus MacBook AaBbccdd Abendte AaBb CcDc AaBb DA EDGE Abede Headings No Site Styles Pane Question 2 10 Marks For a medical research which has been conducted recently provides a table (shown below) representing the height in inches and pulse rate per minute for nine persons Height 68 72 65 70 62 75 78 64 68 Pulse Rate 90 85 88 100 105 98 70 65 72 Find the correlation coefficient and interpret the result. 20 VITA OS Marks Question 3 Consider two machine learning models developed by two different person. The following table demonstrates the predicted values by models and actual values Based on RMS error determine which model is better? Actual value 120 Model 1 183 618 163 455 Model 2 1816 161655 Person Person 2 DF Person 2 163.455 163.455 16 168 Question 4 10 Marks The table below represents the values of x (fork-lift driving experiences in years) and y (monthly insurance in dollar) x 5 64 2 87 12 50 9 71 15 44 6 56 25 42 16 60 Find the least square regression line b. Calculate and critically comment on the value ofr andr MITS6002-Business Analytics Question 5 05 Marks Imagine that we have a collection of photos of CT scan images of head. Each photo shows one Image of head: either front, middle, or back. Our classifier needs to predict which image is shown in each photo. This is a classification problem with N=3 classes. A confusion matrix is shown below: True/Actual Middle 6 Back Front 4 1 1 Front Middle Back 2 3 0 6 Predicted 2 a Determine the recall and precision of the classifier for front, middle and back image. b. Discuss the classifier's performance in terms of recall and precision values. Focus MacBook