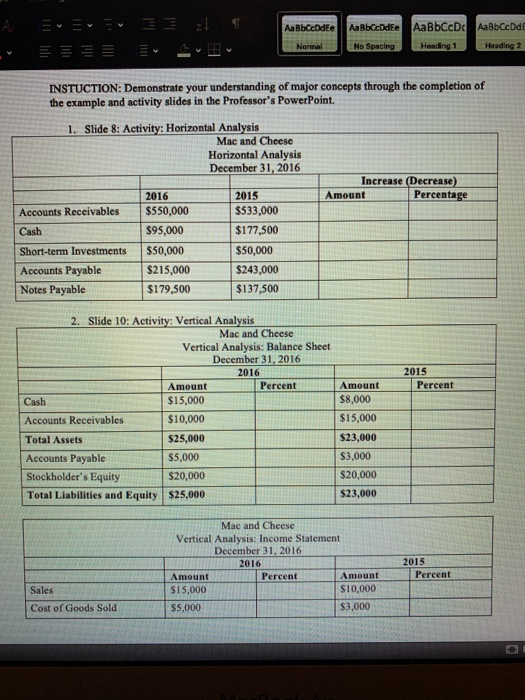
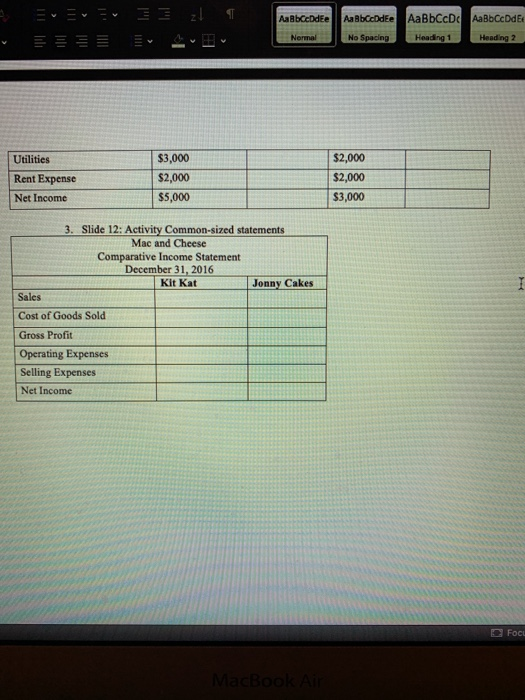
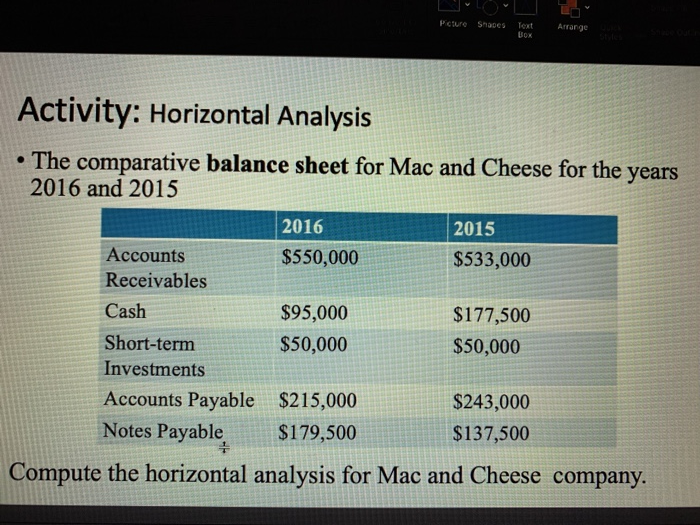
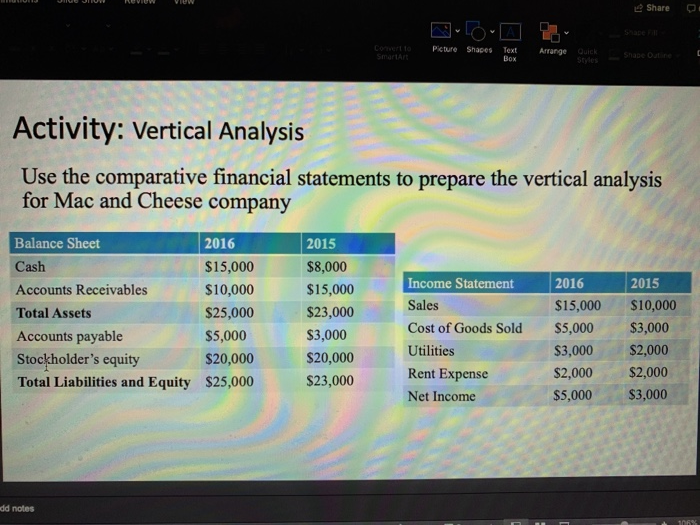
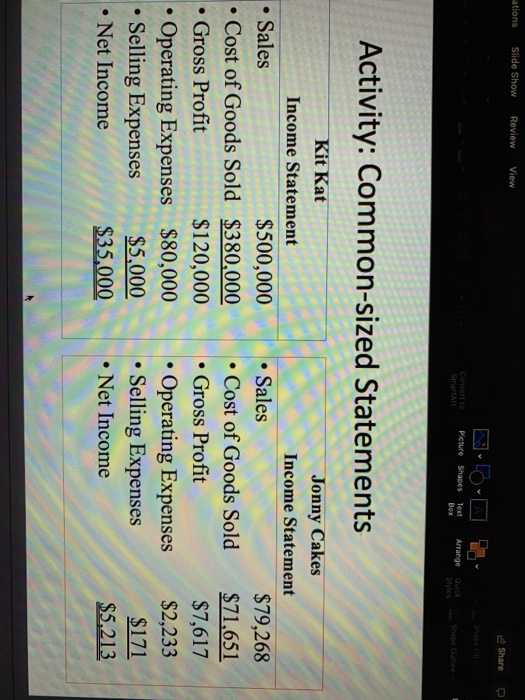
AaRbCcDdEe Aa BbceDdee AaBbCcDc AaBbccd No Spacing Heading 1 Heading 2 INSTUCTION: Demonstrate your understanding of major concepts through the completion of the example and activity slides in the Professor's PowerPoint 1. Slide 8: Activity: Horizontal Analysis Mac and Cheese Horizontal Analysis December 31, 2016 Increase (Decrease) Percentage Accounts Receivables Cash Short-term Investments Accounts Payable Notes Payable 2016 $550,000 $95,000 $50,000 $215,000 $179,500 2015 $533,000 $177,500 $50,000 $243,000 $137,500 2015 Percent 2. Slide 10: Activity: Vertical Analysis Mac and Cheese Vertical Analysis: Balance Sheet December 31, 2016 2016 Amount Percent Cash $15,000 Accounts Receivables $10,000 Total Assets $25,000 Accounts Payable $5,000 Stockholder's Equity $20,000 Total Liabilities and Equity $25,000 Amount $8.000 $15,000 $23,000 $3.000 $20,000 $23,000 Mac and Cheese Vertical Analysis: Income Statement December 31, 2016 2016 Amount Percent Amount $15,000 S10,000 2015 Percent Sales Cost of Goods Sold $5,000 $3,000 Aa Bbccdee Aa Bbccddee No Spacing AaBbCcDc AaBb CcDdEt Heading 1 Hending 2 Normal Utilities Rent Expense Net Income $3,000 $2,000 $5,000 $2,000 $2,000 $3,000 3. Slide 12: Activity Common-sized statements Mac and Cheese Comparative Income Statement SILLE December 31, 2016 Kit Kat Jonny Cakes Sales Cost of Goods Sold Gross Profit Operating Expenses Selling Expenses Net Income Focu Picture S es Text Arrange Activity: Horizontal Analysis The comparative balance sheet for Mac and Cheese for the years 2016 and 2015 2016 2015 Accounts $550,000 $533,000 Receivables Cash $95,000 $177,500 Short-term $50,000 $50,000 Investments Accounts Payable $215,000 $243,000 Notes Payable $179,500 $137,500 Compute the horizontal analysis for Mac and Cheese company. Share on Picture Shapes Text Arrange quick snage Outine Styles Activity: Vertical Analysis Use the comparative financial statements to prepare the vertical analysis for Mac and Cheese company Balance Sheet Cash Accounts Receivables Total Assets Accounts payable Stockholder's equity Total Liabilities and Equity 2016 $15,000 $10,000 $25,000 $5,000 $20,000 $25,000 2015 $8,000 $15,000 $23,000 $3,000 $20,000 $23,000 2016 $15,000 Income Statement Sales Cost of Goods Sold Utilities Rent Expense Net Income 2015 $10,000 $3,000 $2,000 $2,000 $3,000 $3,000 $2,000 $5,000 dd notes ations Slide Show Review View Share Convert Picture Shapes Text Arrange BOX e e Activ V: Common-sized Statements OR Kit Kat Income Statement Sales $500,000 Cost of Goods Sold $380,000 Gross Profit $120,000 Operating Expenses $80,000 Selling Expenses Net Income $35,000 Jonny Cakes Income Statement Sales $79,268 Cost of Goods Sold $71,651 Gross Profit $7,617 Operating Expenses $2,233 Selling Expenses $171 Net Income $5.213
