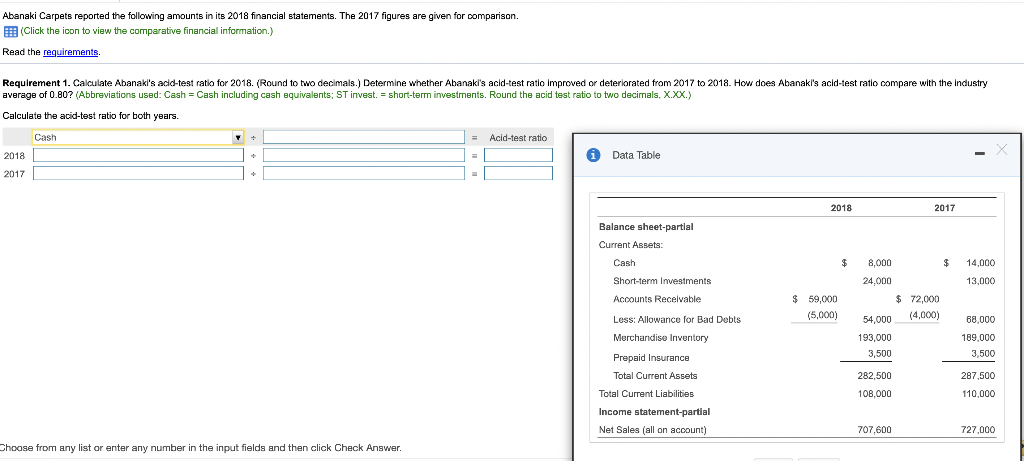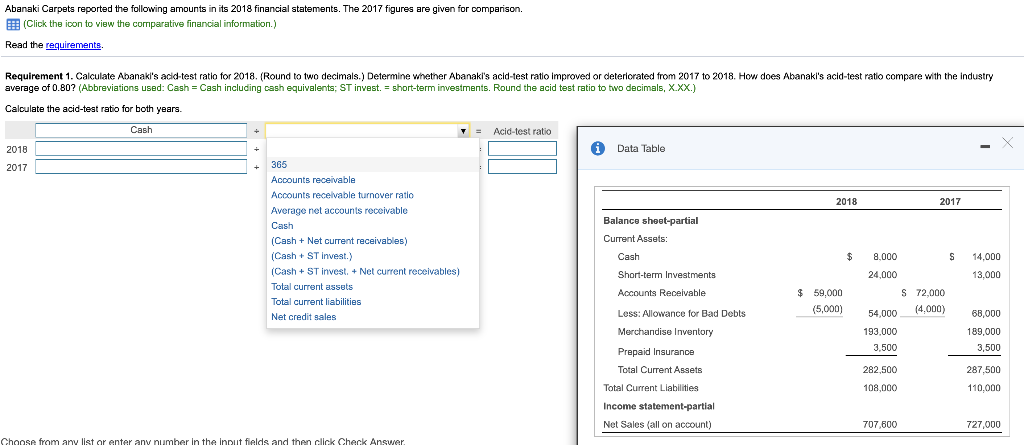

Abanaki Carpets reported the following amounts in its 2018 financial statements. The 2017 figures are given for comparison. (Click the icon to view the comparative financial information.) Read the requirements. Requirement 1. Calculate Abanaki's acid-test ratio for 2018. (Round to two decimals.) Determine whether Abanakl's acid-test ratio Improved or deteriorated from 2017 to 2018. How does Abanakl's acid-test ratio compare with the Industry average of 0.80? (Abbreviations used: Cash Cash including cash equivalents; ST invest. = short-term investments. Round the acid test ratio to two decimals, X.XX.) Calculate the acid-test ratio for both years. Cash Acid-test ratio 2018 i Data Table 2017 2018 2017 Balance sheet-partial Current Assets: Cash $ 14,000 13,000 Short-term Investments Accounts Recevable $ 59,000 (5,000) 8,000 $ 24,000 $ 72,000 54,000 (4,000) 193,000 3,500 68,000 189.000 3,500 Less: Allowance for Bad Debts Merchandise Inventory Prepaid Insurance Total Current Assets Total Current Liabilities Income statement partial Net Sales (all on account) ( 282,500 287,500 108,000 110,000 707,600 727,000 Choose from any list or enter any number in the input fields and then click Check Answer. Abanaki Carpets reported the following amounts in its 2018 financial statements. The 2017 figures are given for comparison. (Click the icon to view the comparative financial information.) Read the requirements. Requirement 1. Calculate Abanakl's acid-test ratio for 2018. (Round to two decimals.) Determine whether Abanaki's acid-test ratio improved or deteriorated from 2017 to 2018. How does Abanakl's acid-test ratio compare with the industry average of 0.80? (Abbreviations used: Cash Cash including cash equivalents: ST invest. = short-term investments. Round the acid test ratio to two decimals, X.XX.) Calculate the acid-test ratio for both years Cash Y = Acid-test ratio 2018 Data Table 2017 2018 2017 365 Accounts receivable Accounts receivable turnover ratio Average net accounts receivable Cash (Cash + Net current receivables) (Cash + ST Invest.) (Cash + ST invest. + Net current receivables) Total current assets Total current liabilities Net credit sales Balance sheet-partial Current Assets Cash $ S 14.000 8,000 24,000 13,000 Short-term Investments Accounts Receivable $ 59,000 (5,000) S 72.000 54.000 (4.000) 68,000 193,000 3,500 189,000 3,500 Less: Allowance for Bad Debts Merchandise Inventory Prepaid Insurance Total Current Assets Total Current Liabilities Income statement-partial Net Sales (all on account) 282,500 287,500 108,000 110,000 707,600 727,000 Choose from any list or enter any number in the input fields and then click Check


