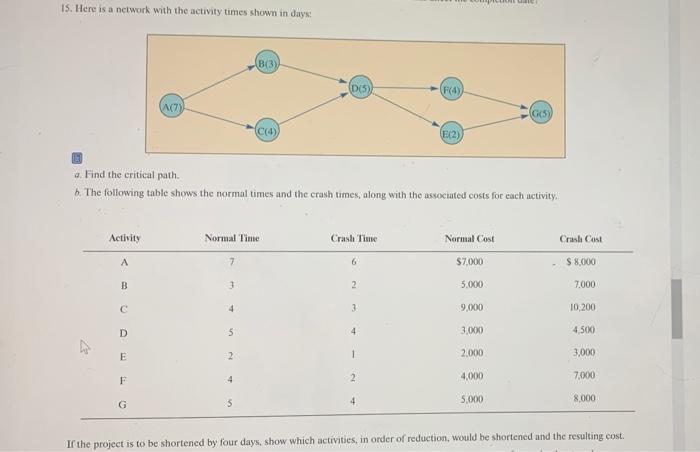
15. Here is a network with the activity times shown in days B(3) 005 F(4) A(7) (G59 C(4) E(2) Find the critical path b. The following table shows the normal times and the crash times, along with the associated costs for each activity. Activity Normal Time Crash Time Normal Cost Crash Cost 7 6 $7.000 $8,000 B 1 2 5.00 7.000 C 4 3 9.000 10.200 D 5 4 3,000 4.500 E 2 1 2,000 3,000 F 4 2 4,000 7,000 G $ 8,000 4 5.000 Ir the project is to be shortened by four days, show which activities, in order of reduction, would be shortened and the resulting cost. Modified table for problem 15. Activity Crash Cost/day Crash days available (NT-CT) B D E Normal Time (NT) 7 3 4 5 2 4 5 Crash Time (CT) 6 2 3 4 1 2 4 Normal Cost (NC) $7,000 5,000 9,000 3,000 2,000 4,000 5,000 Crash Cost (CC) $8,000 7,000 10,200 4,500 3,000 7,000 8,000 1 1 2 1 $1,000 2,000 1,200 1,500 1,000 1,500 3,000 15. Here is a network with the activity times shown in days B(3) 005 F(4) A(7) (G59 C(4) E(2) Find the critical path b. The following table shows the normal times and the crash times, along with the associated costs for each activity. Activity Normal Time Crash Time Normal Cost Crash Cost 7 6 $7.000 $8,000 B 1 2 5.00 7.000 C 4 3 9.000 10.200 D 5 4 3,000 4.500 E 2 1 2,000 3,000 F 4 2 4,000 7,000 G $ 8,000 4 5.000 Ir the project is to be shortened by four days, show which activities, in order of reduction, would be shortened and the resulting cost. Modified table for problem 15. Activity Crash Cost/day Crash days available (NT-CT) B D E Normal Time (NT) 7 3 4 5 2 4 5 Crash Time (CT) 6 2 3 4 1 2 4 Normal Cost (NC) $7,000 5,000 9,000 3,000 2,000 4,000 5,000 Crash Cost (CC) $8,000 7,000 10,200 4,500 3,000 7,000 8,000 1 1 2 1 $1,000 2,000 1,200 1,500 1,000 1,500 3,000