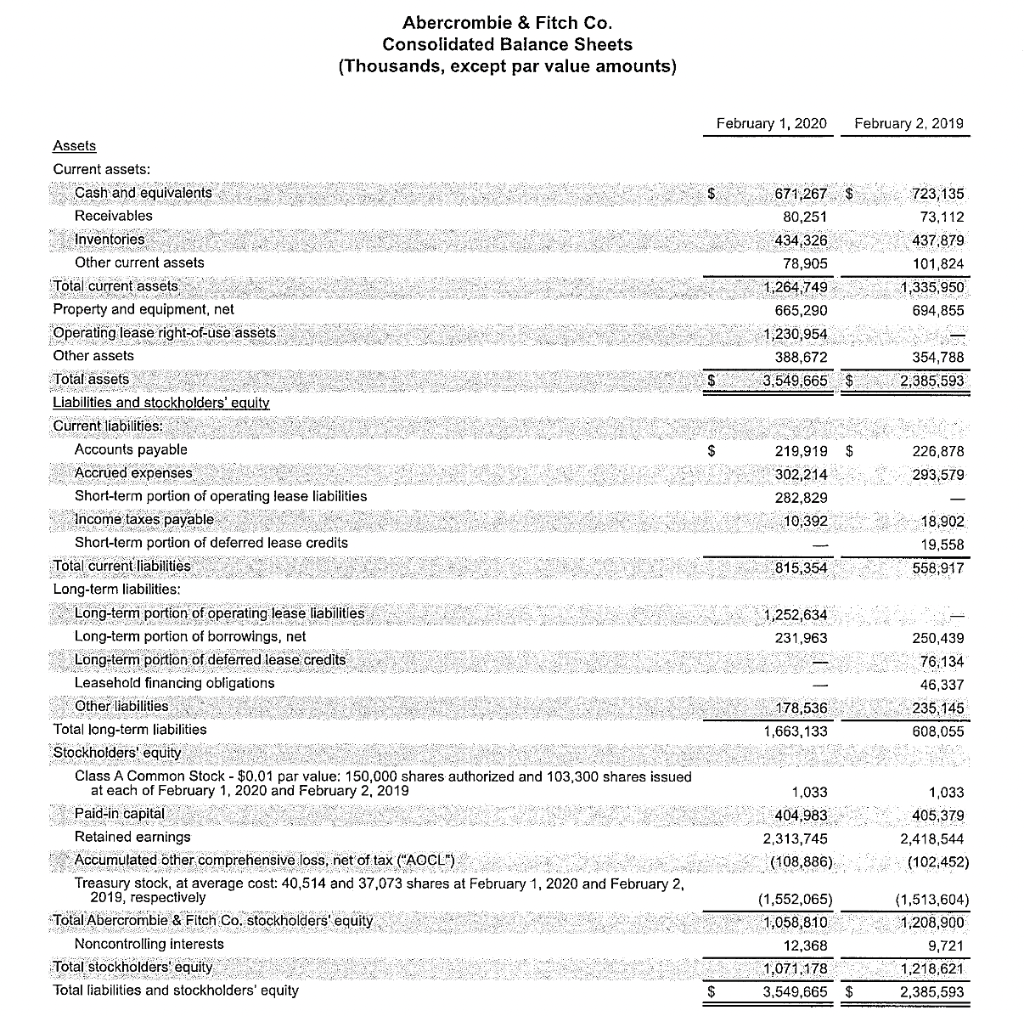
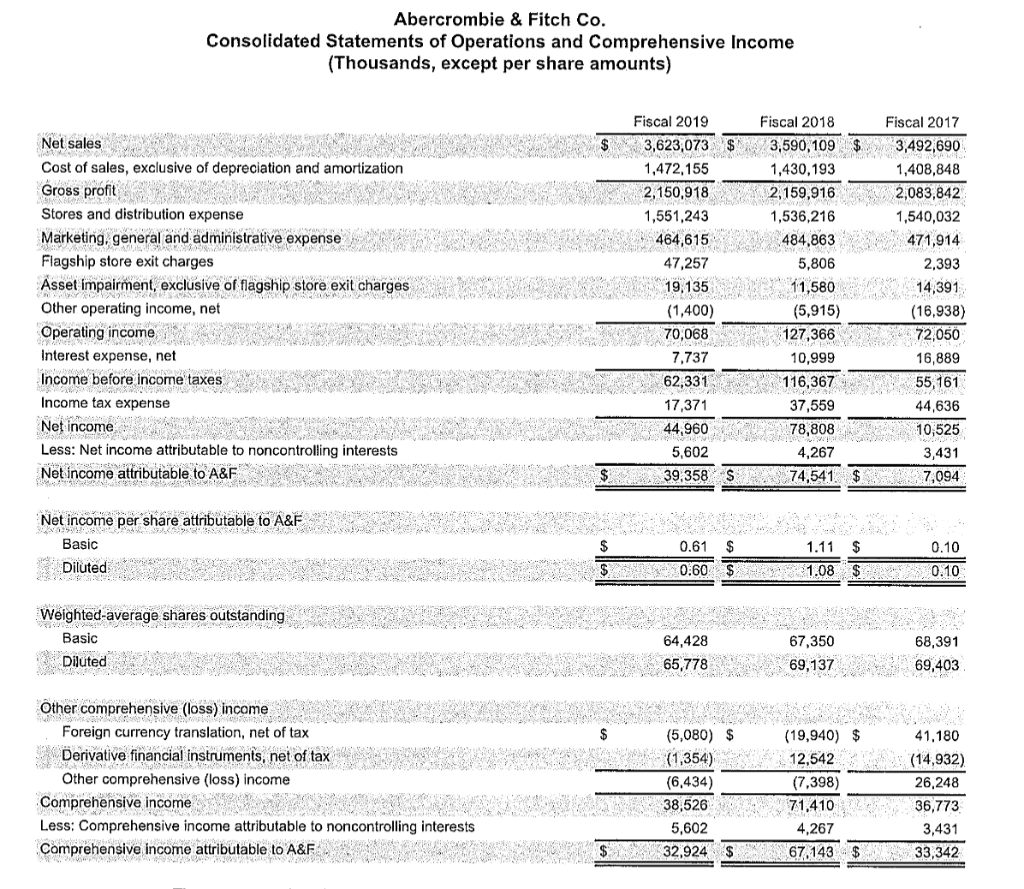
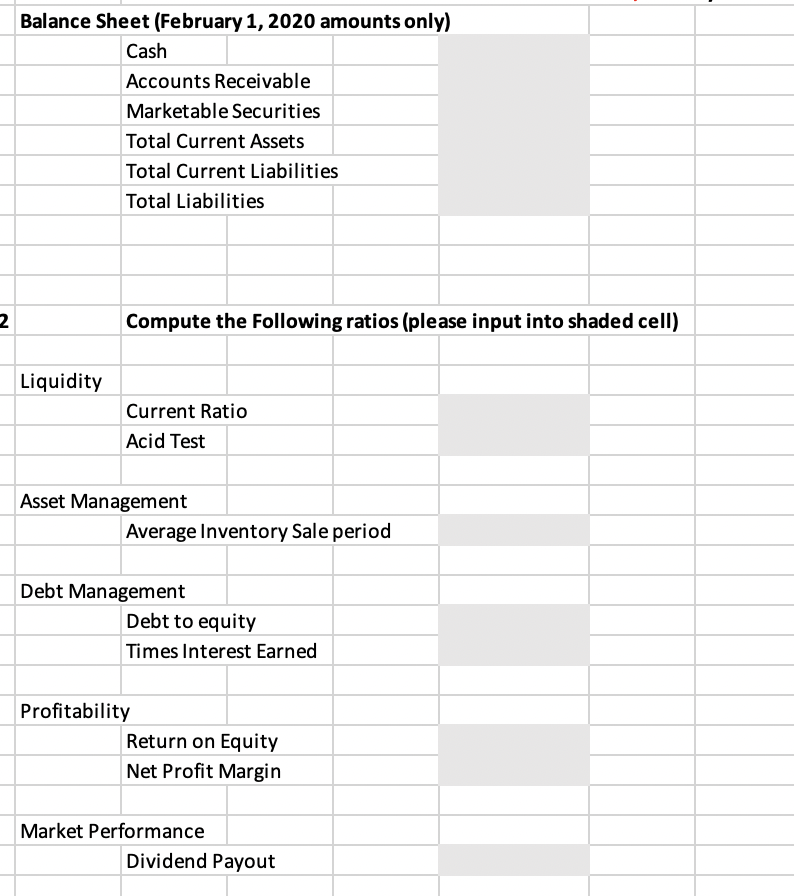
Abercrombie & Fitch Co. Consolidated Balance Sheets (Thousands, except par value amounts) February 1, 2020 February 2, 2019 67 $ 723,135 671,267 80,251 73,112 434,326 437,879 78,905 101,824 1,264,749 1,335,950 665,290 694,855 1,230,954 388,672 354,788 3,549,665 $2,385,593 226,878 293,579 219,919 $ 302,214 282.829 10,392 Assets Current assets: Cash and equivalents Receivables Inventories Other current assets Total current assets Property and equipment, net Operating lease right-of-use assets Other assets Total assets Liabilities and stockholders' equity Current liabilities: Accounts payable Accrued expenses Short-term portion of operating lease liabilities Income taxes payable Short-term portion of deferred lease credits Total current liabilities Long-term liabilities: Long-term portion of operating lease liabilities Long-term portion of borrowings, net Long-term portion of deferred lease credits Leasehold financing obligations Other liabilities Total long-term liabilities Stockholders' equity Class A Common Stock - $0.01 par value: 150,000 shares authorized and 103,300 shares issued at each of February 1, 2020 and February 2, 2019 Paid-in capitale Retained earnings Accumulated other comprehensive loss, net of tax ("AOCL") Treasury stock, at average cost: 40,514 and 37,073 shares at February 1, 2020 and February 2, 2019, respectively Total Abercrombie & Fitch Co. stockholders' equity Noncontrolling interests Total stockholders' equity Total liabilities and stockholders' equity 18,902 19,558 558,917 815,354 1,252,634 231,963 250,439 76,134 46,337 235,145 608,055 178,536 1,663,133 1,033 404,983 2,313,745 (108,886) 1,033 405,379 2,418,544 (102,452) (1,552,065) (1,513,604) 1,058,810 1,208,900 12,368 9,721 1,071,1781,218,621 3,549,665 $ 2,385,593 $ Abercrombie & Fitch Co. Consolidated Statements of Operations and Comprehensive Income (Thousands, except per share amounts) Net sales Cost of sales, exclusive of depreciation and amortization Gross profit 464,615 484,863 5,806 Stores and distribution expense Marketing, general and administrative expense Flagship store exit charges Asset impairment, exclusive of flagship store exit charges STA Other operating income, net Operating income i Interest expense, net Income before income taxes Income tax expense Net income Less: Net income attributable to noncontrolling interests Net income attributable to A&F Fiscal 2019 Fiscal 2018 Fiscal 2017 $ 3,623,073 $3,590, 109$ 3,492,690 1,472, 155 1,430,193 1,408,848 2,150,918 2,159,9162,083,842 1,551,243 1,536,216 1,540,032 471,914 47,257 2,393 19,135 11,580 14,391 (1,400) (5,915) (16.938) 70,068 127,36672,050 7,737 10,999 16,889 62.331 116,367 55,161 17,371 37,559 44,636 44,960 78,808 10,525 5,602 4,267 3,431 39,358 $ 74,541. $7,094 We Net income per share attributable to A&F Basic Diluted 0.61 $ 1.11 $ 1.08 $ 0.10 0.10 0.60 $ Weighted average shares outstanding Basic Diluted 64,428 67,350 68,391 69,403 65,778 69,137 Other comprehensive (loss) income Foreign currency translation, net of tax Derivative financial instruments, net of tax Other comprehensive (loss) income Comprehensive income Less: Comprehensive income attributable to noncontrolling interests Comprehensive income attributable to A&F (5,080) $ (1,354) (6,434) 38,526 5,602 32,924 $ (19,940) $ 41.180 12,542W (14,932) (7,398) 26,248 71,410 36,773 4,267 3,431 67.143 $33,342 Balance Sheet (February 1, 2020 amounts only) Cash Accounts Receivable Marketable Securities Total Current Assets Total Current Liabilities Total Liabilities 2 Compute the following ratios (please input into shaded cell) Liquidity Current Ratio Acid Test Asset Management Average Inventory Sale period Debt Management Debt to equity Times Interest Earned Profitability Return on Equity Net Profit Margin Market Performance Dividend Payout February 1, 2020 and February 2, 2019 2020 2019 Inventory Total Stockholders' Equity Dividends for Abercrombie & Fitch $ 0.80 Income Statement (Fiscal 2019 only) Sales Cost of Goods Sold Interest Expense Income Tax Expense Net Income Basic Earnings per share