

Question
Above is 2 years and 4 months of actual demand data for a new call center.For example, cell B4 represenets 12,380 calls received in January
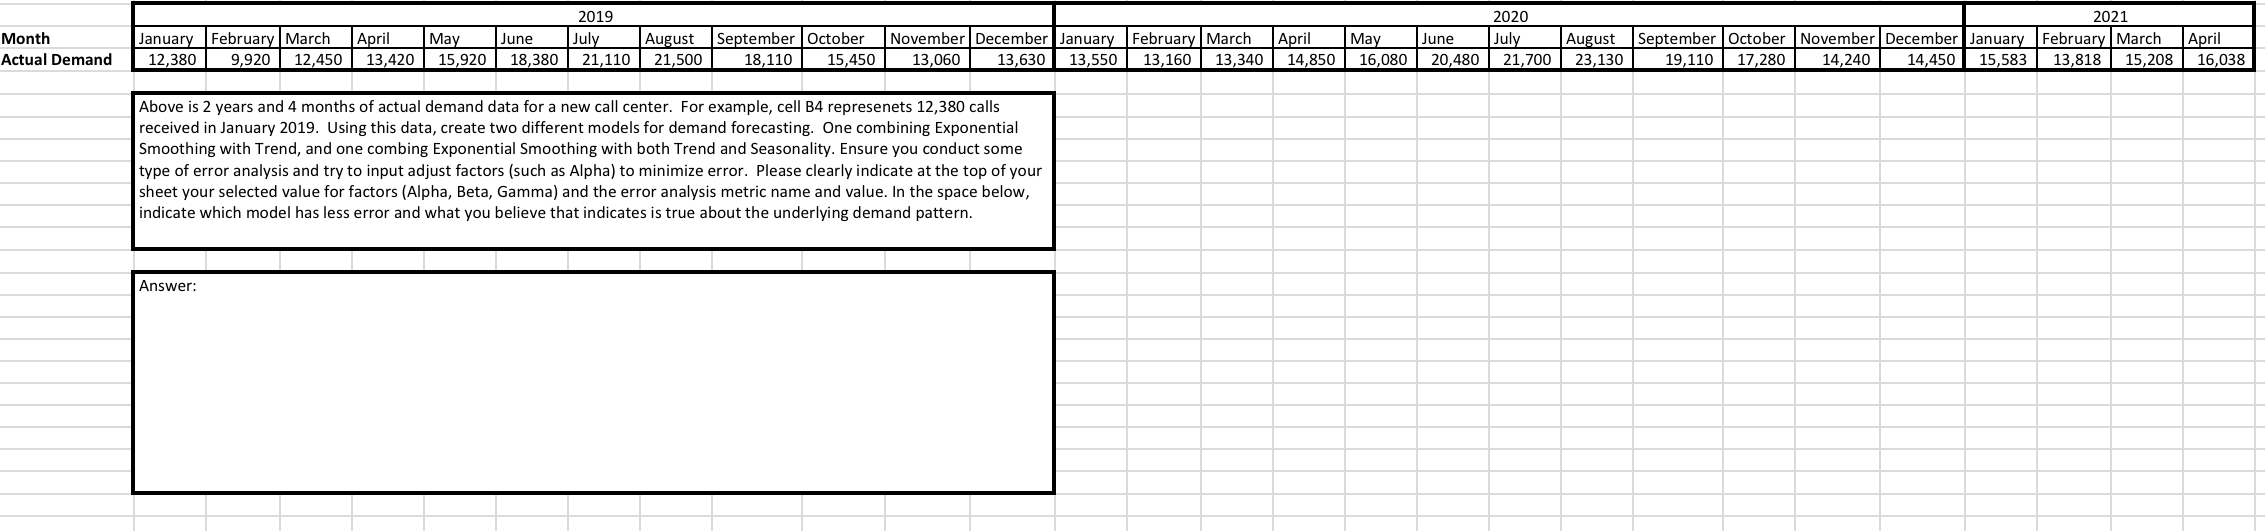
Above is 2 years and 4 months of actual demand data for a new call center.For example, cell B4 represenets 12,380 calls received in January 2019.Using this data, create two different models for demand forecasting.One combining Exponential Smoothing with Trend, and one combing Exponential Smoothing with both Trend and Seasonality. Ensure you conduct some type of error analysis and try to input adjust factors (such as Alpha) to minimize error.Please clearly indicate at the top of your sheet your selected value for factors (Alpha, Beta, Gamma) and the error analysis metric name and value. In the space below, indicate which model has less error and what you believe that indicates is true about the underlying demand pattern.
Step by Step Solution
There are 3 Steps involved in it
Step: 1

Get Instant Access to Expert-Tailored Solutions
See step-by-step solutions with expert insights and AI powered tools for academic success
Step: 2

Step: 3
Ace Your Homework with AI
Get the answers you need in no time with our AI-driven, step-by-step assistance
Get Started
Practical Linear Algebra A Geometry Toolbox
Authors: Gerald Farin, Dianne Hansford
4th Edition
1003051219, 9781003051213