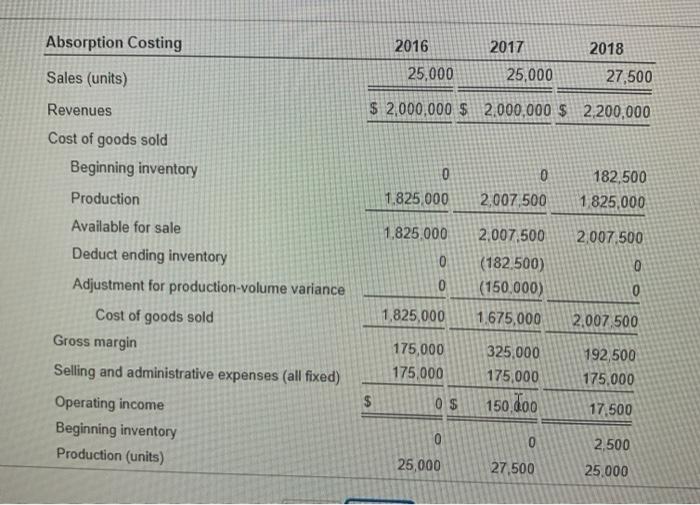
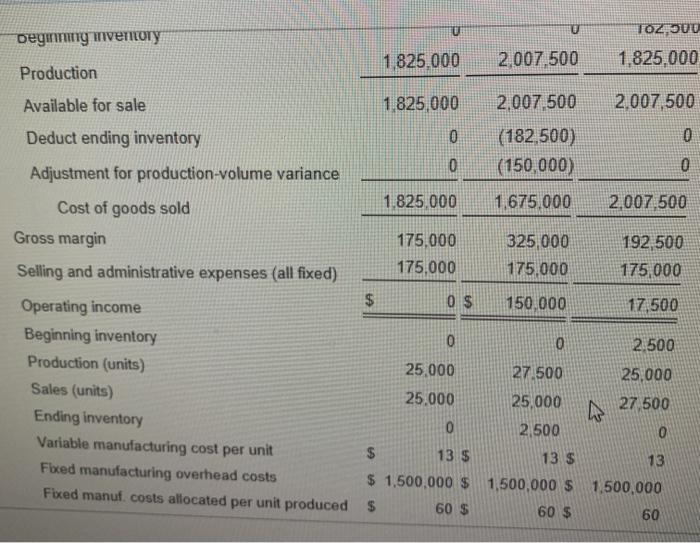
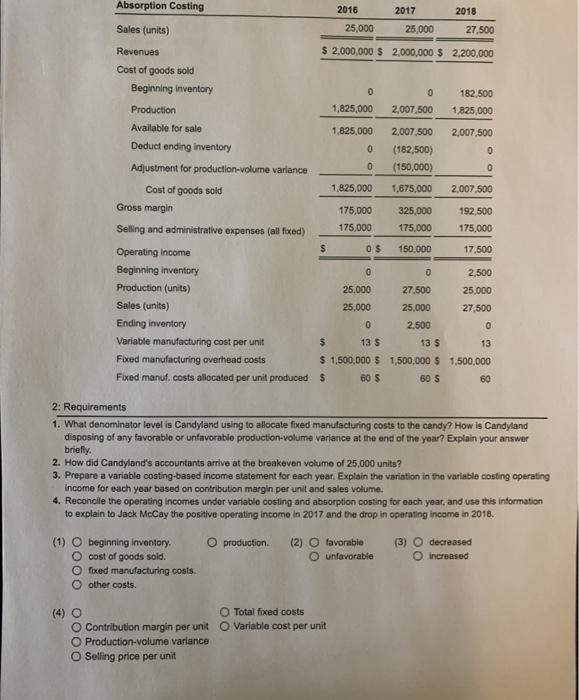
Absorption Costing 2016 2017 2018 27,500 Sales (units) 25,000 25,000 Revenues $ 2,000,000 $2,000,000 $2,200,000 Cost of goods sold Beginning inventory Production 0 1.825,000 0 2,007,500 182,500 1 825,000 1,825,000 2,007,500 2,007,500 0 (182.500) (150,000) 0 0 0 1,825,000 1.675,000 2,007 500 Available for sale Deduct ending inventory Adjustment for production-volume variance Cost of goods sold Gross margin Selling and administrative expenses (all fixed) Operating income Beginning inventory Production (units) 175,000 175,000 325,000 175,000 192,500 175,000 $ 0$ 150 doo 17.500 0 0 25,000 2,500 25.000 27,500 0 TOZ 900 Degmatig ventory 1 825.000 2,007 500 1.825.000 Production Available for sale 1 825,000 2.007 500 2.007 500 Deduct ending inventory 0 (182,500) 0 0 (150.000) 0 Adjustment for production-volume variance 1.825.000 1,675.000 2.007 500 Cost of goods sold Gross margin 175.000 325,000 192,500 Selling and administrative expenses (all fixed) 175,000 175.000 175,000 $ 0 $ 150,000 Operating income 17,500 Beginning inventory 0 0 2.500 Production (units) 25,000 27.500 25.000 Sales (units) 25.000 25,000 27 500 Ending inventory 0 2.500 0 Variable manufacturing cost per unit $ 13 $ 13 $ 13 Fbced manufacturing overhead costs $ 1,500,000 $ 1,500,000 $ 1,500,000 Fixed manuf. costs allocated per unit produced $ 60 $ 60 $ 60 9 2. Candyland uses standard costing to produce a particularly popular type of candy, Candyland's President, Jack McCay was unhappy after reviewing the income statements for the first three years of business. He said, "I was told by our accountants and in fact, I have memorized--that our breakeven volume is 25,000 units. I was happy that we reached that sales goal in each of our first two years. But, here's the strange thing: In our first year, we sold 25,000 units and indeed we broke even. Then, in our second year we sold the same volume and had a signficant, positive operating income. I didn't complain, of course... but here's the bad part. In our third year, we sold 10% more candy, but our operating income dropped by nearly 90% from what it was in the second year! We didn't change our selling price of cost structure over the past three years and have no price, efficiency, or spending variances... so what's going on? (Click the icon to view the absorption costing income statements for the three years.) Read the requirements Requirement 1. What denominator level is Candyland using to allocate fixed manufacturing costs to the candy? How is Candyland disposing of any favorable or unfavorable production-volume variance at the end of the year? Explain your answer briefly. The denominator level used to allocate fixed manufacturing costs is units. We can see from Candyland's income statements that it disposes of any production-volume variance against (1) In 2017, 27,500 units were produced instead of the budgeted 25,000 units. This resulted in a (2) production-volume variance; which, when written off (3) gross margin Requirement 2. How did Candyland's accountants arrive at the breakeven volume of 25,000 units? (4) (5) Breakeven quantity 2016 2017 2018 Requirement 3. Prepare a variable costing-based income statement for each year. Explain the variation in the variable costing operating income for each year based on contribution margin per unit and sales volume. (Complete all answer boxes. Enter a "0" for any zero amounts.) 2016 2017 2018 Sales (units) Revenues Variable cost of goods sold Beginning inventory Variable manufacturing costs Deduct ending inventory Variable cost of goods sold Contribution margin Fixed manufacturing costs Fixed selling and administrative costs Operating income Explain the variation in the variable costing operating income for each year based on contribution margin per unit and sales volume by completing the following table. (Complete all answer boxes. Entor a "O" for any zero amounts.) 2016 2017 2018 Contribution margin Total fixed costs Operating income Requirement 4. Reconcile the operating incomes under variable costing and absorption costing for each year, and use this information to explain to Jack McCay the positive operating income in 2017 and the drop in operating income in 2018. (Complete all answer boxes. Enter a "o" for any zero amounts. Use parentheses or a minus sign for negative differences.) Reconciliation of absorption/variable costing operating Income 2016 2017 2018 (1) Absorption costing operating income (2) Variable costing operating income (3) Difference (1)-(2) (4) Fixed mfg. costs in ending inventory (Absorption) (5) Fixed mfg. costs in beginning inventory (Absorption) (6) Difference (4) . (5) Use the reconciliation table you completed above to explain to Jack McCay the positive operating income in 2017 and the drop in operating income in 2018, that is shown on the absorption costing income statement. (6) production was less than sales, i.e., all of the fixed costs that were included in a prior ending inventory, COGS in this year. The contribution margin in this year, for absorption costing, shows the COGS also contains the allocated fixed manufacturing costs of the units sold resulting in an operating income that is lower. there were units in ending inventory. These units had each absorbed $22 of fixed costs per unit, which assets on Candyland's balance sheet until they were sold. Cost of goods sold was accordingly reduced by the production volume variance, resulting in a positive operating income even though sales were at breakeven levels. 1: Data Table Absorption Costing 2016 2017 2018 Sales (units) 25,000 25,000 27,500 Revenues $ 2,000,000 $ 2,000,000 $ 2.200,000 Cost of goods sold Beginning inventory 0 0 182,500 Production 1.825,000 2,007,500 1,825,000 Available for sale 1,825,000 2,007,500 2,007,500 Deduct ending inventory 0 (182,500) 0 0 Adjustment for production-volume variance (150,000) 0 Cost of goods sold 1.825,000 1.675,000 2,007 500 Gross margin 175,000 325,000 192,500 Selling and administrative expenses (all fixed) 175,000 175,000 175.000 $ OS 150.000 Operating Income 17.500 Beginning inventory 0 0 2,500 Production (units) 25,000 27.500 25,000 Sales (units) 25,000 25,000 27.500 Ending Inventory 0 2.500 0 Variable manufacturing cost per unit $ 13 $ 13 $ 13 Fixed manufacturing overhead costs $ 1,500,000 $ 1,500,000 $ 1,500,000 Fixed manuf. costs allocated per unit produced $ 60 $ 60 5 60 2: Requirements 1. What denominator level is Candyland using to allocate fixed manufacturing costs to the candy? How is Candyland disposing of any favorable or unfavorable production-volume variance at the end of the year? Explain your answer briefly 2. How did Candyland's accountants arrive at the breakeven volume of 25,000 units? 3. Prepare a variable costing-based income statement for each year. Explain the variation in the variable costing operating Income for each year based on contribution margin per unit and sales volume. 4. Reconcile the operating incomes under variable costing and absorption costing for each year, and use this information to explain to Jack McCay the positive operating income in 2017 and the drop in operating income in 2018. (1) production (2) O favorable unfavorable (3) O decreased increased 0 000 beginning inventory cost of goods sold. fixed manufacturing costs. other costs. Total fixed costs Contribution margin per unit o Variable cost per unit O Production-volume variance O Selling price per unit (5) O Total fixed costs Contribution margin per unit Variable cost per unit Production-volume variance Selling price per unit (6) O In 2017 In 2018 (7) O In 2017 O In 2018