Answered step by step
Verified Expert Solution
Question
1 Approved Answer
according information for business decisions. Week 3 Assignment: Chapter 6 Problem #1 Requirement: You will complete most of your weekly assignments using Excel. These assignments



according information for business decisions.
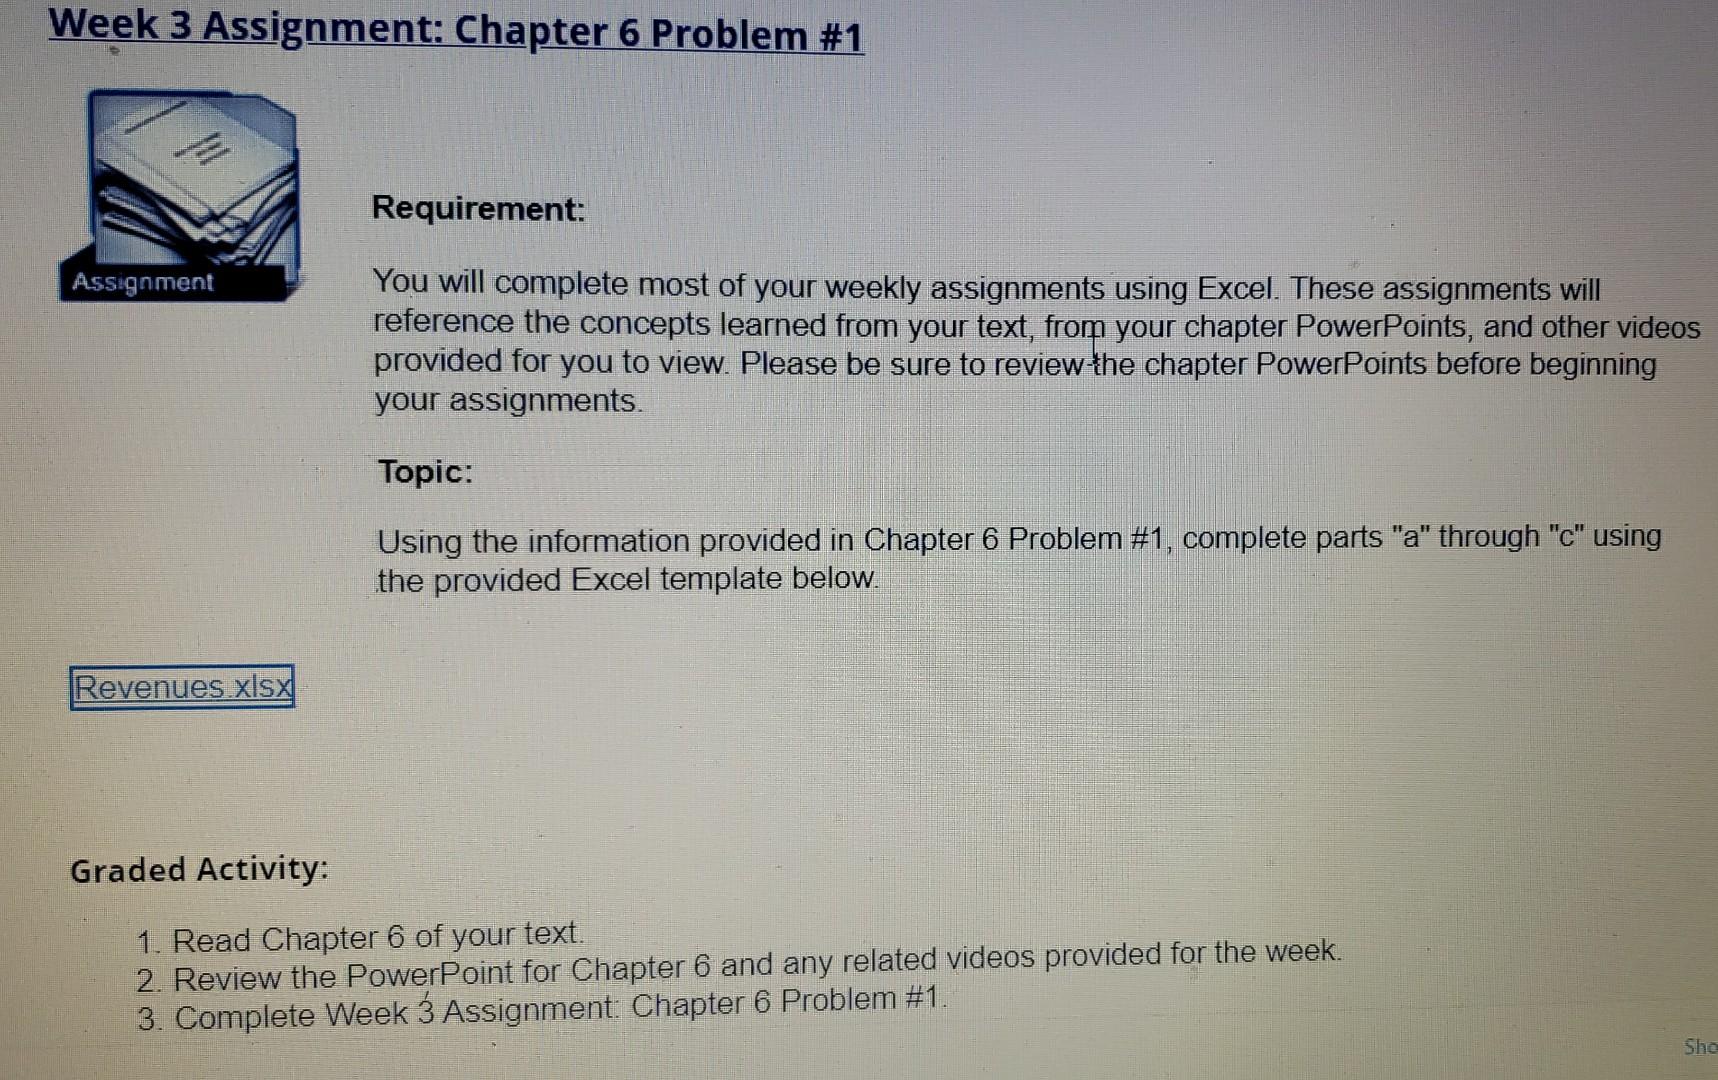
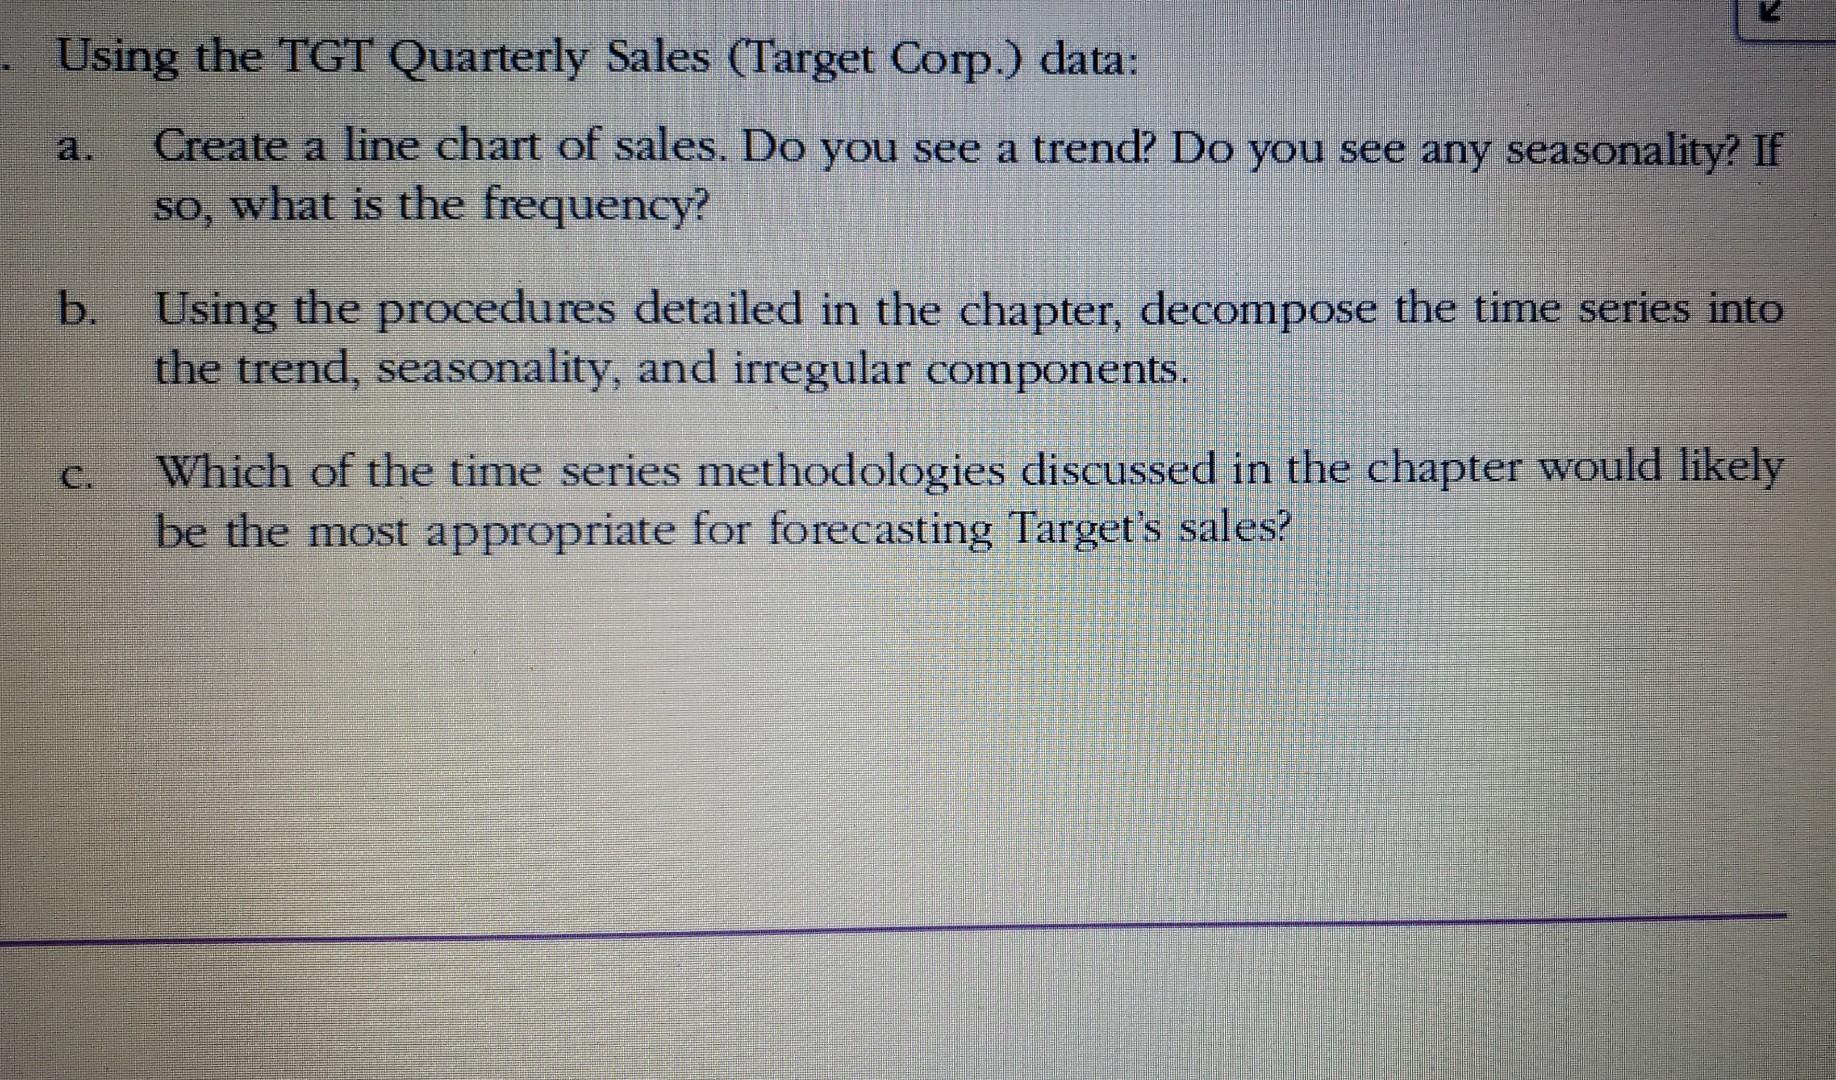
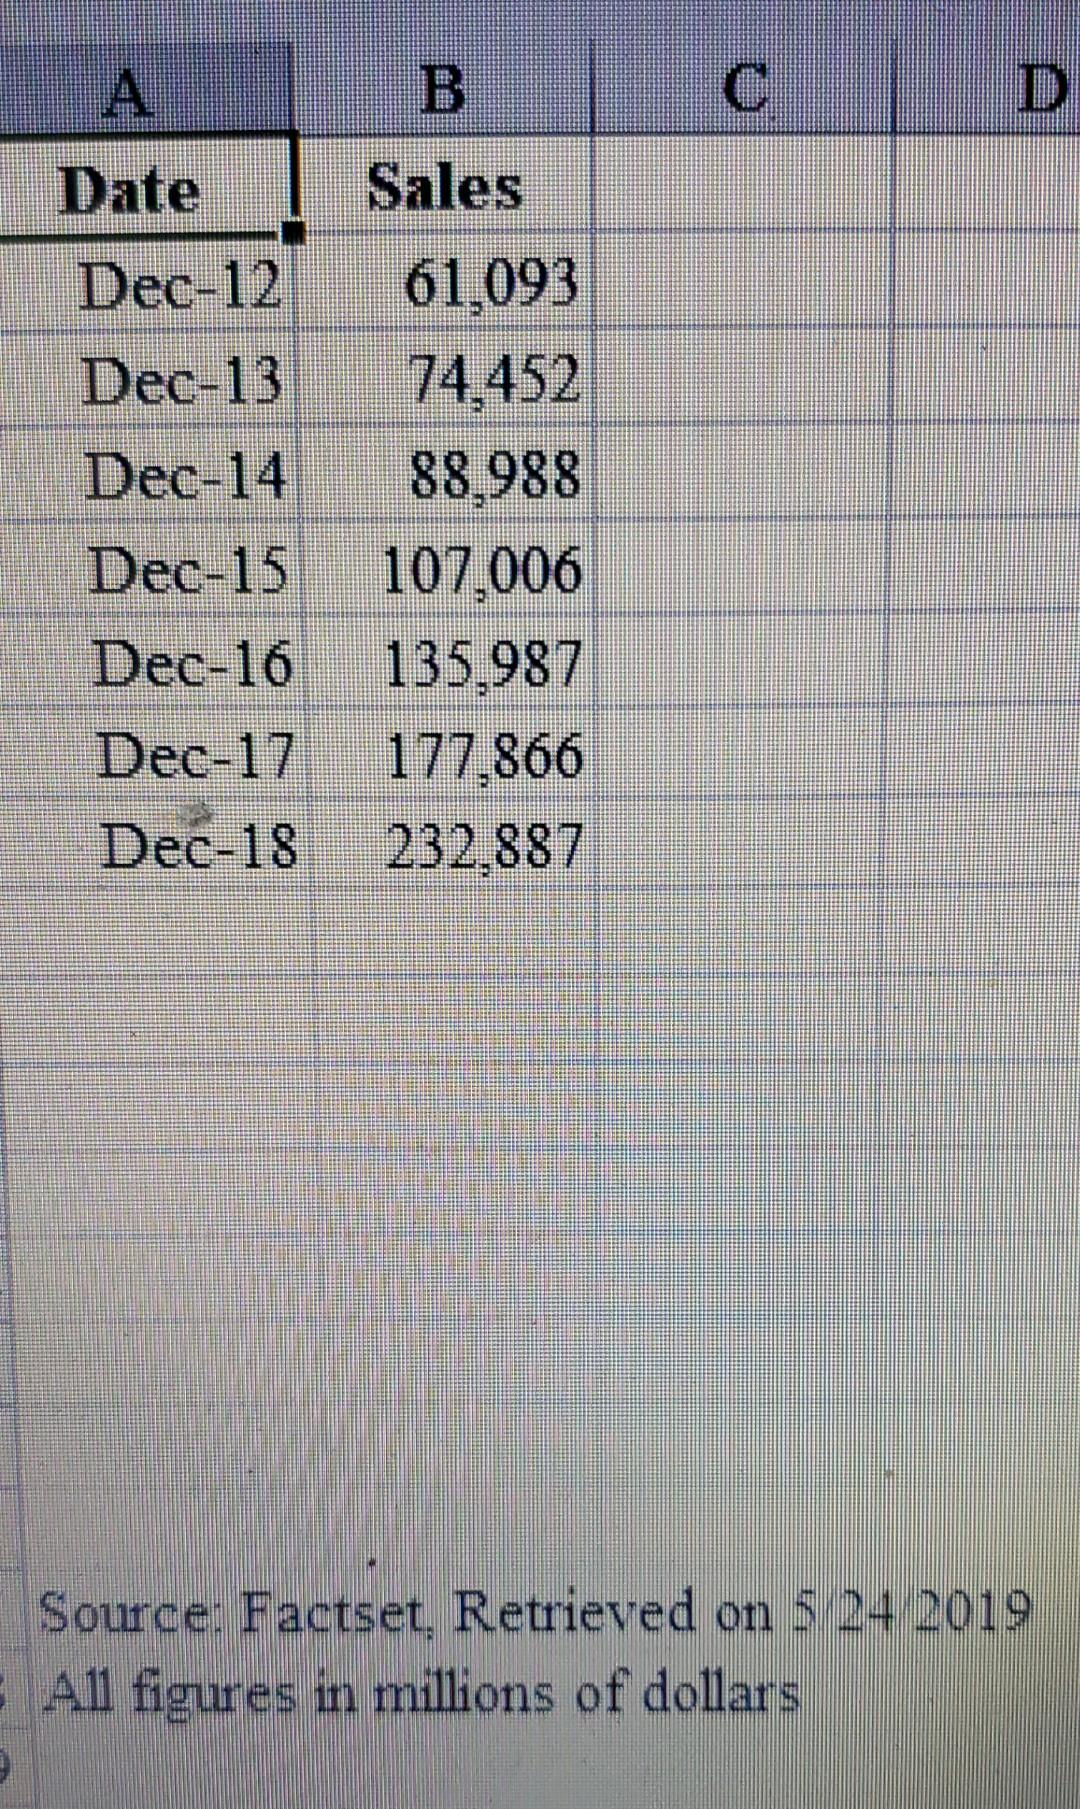
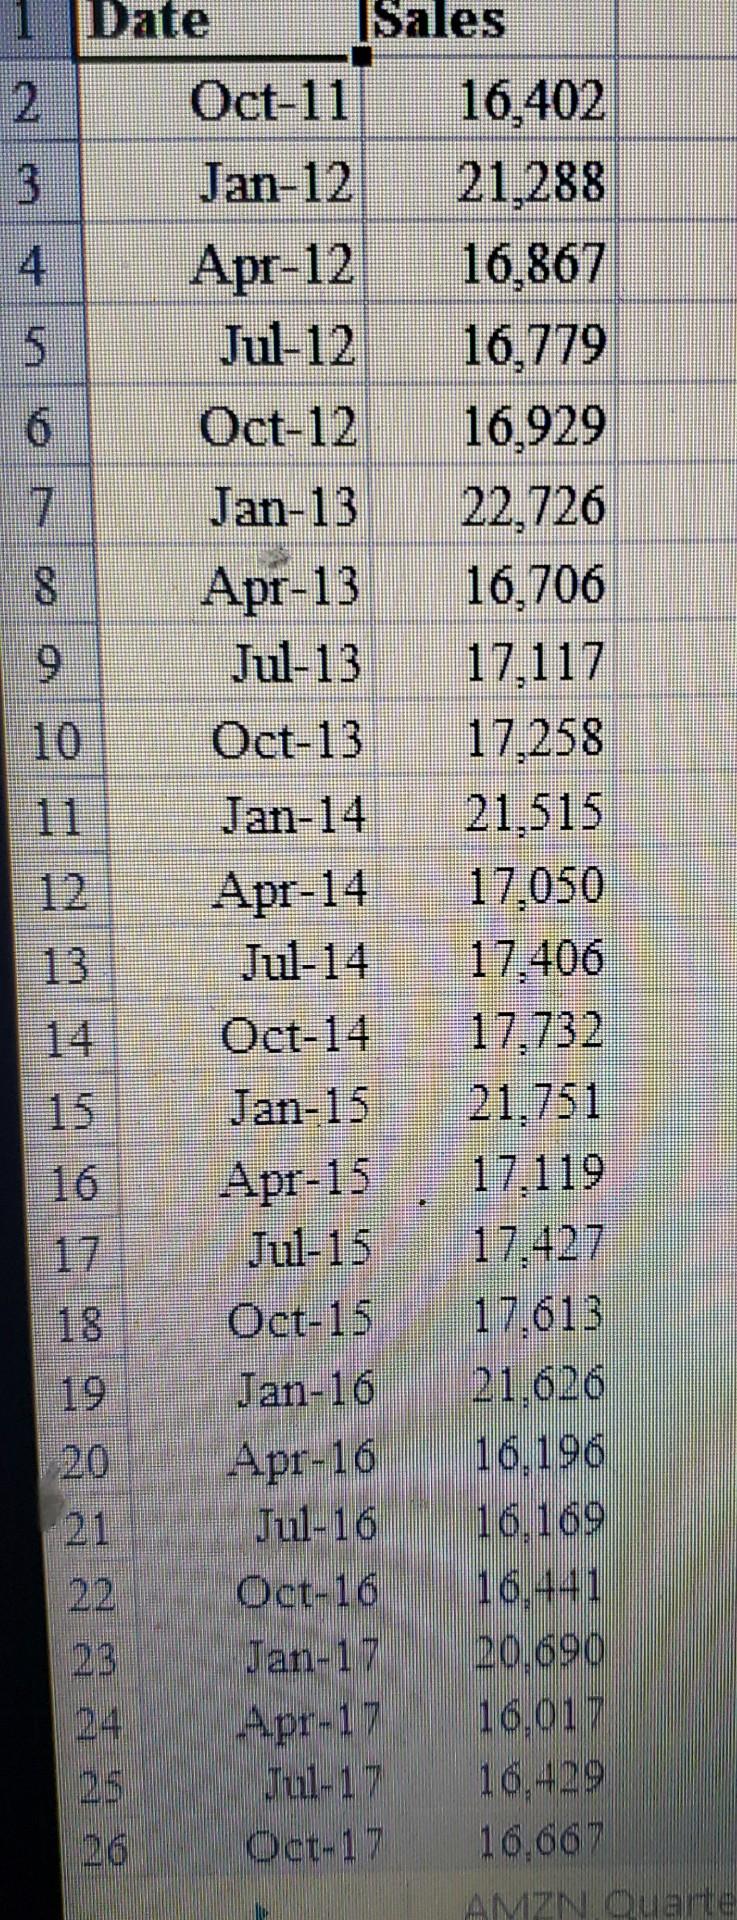
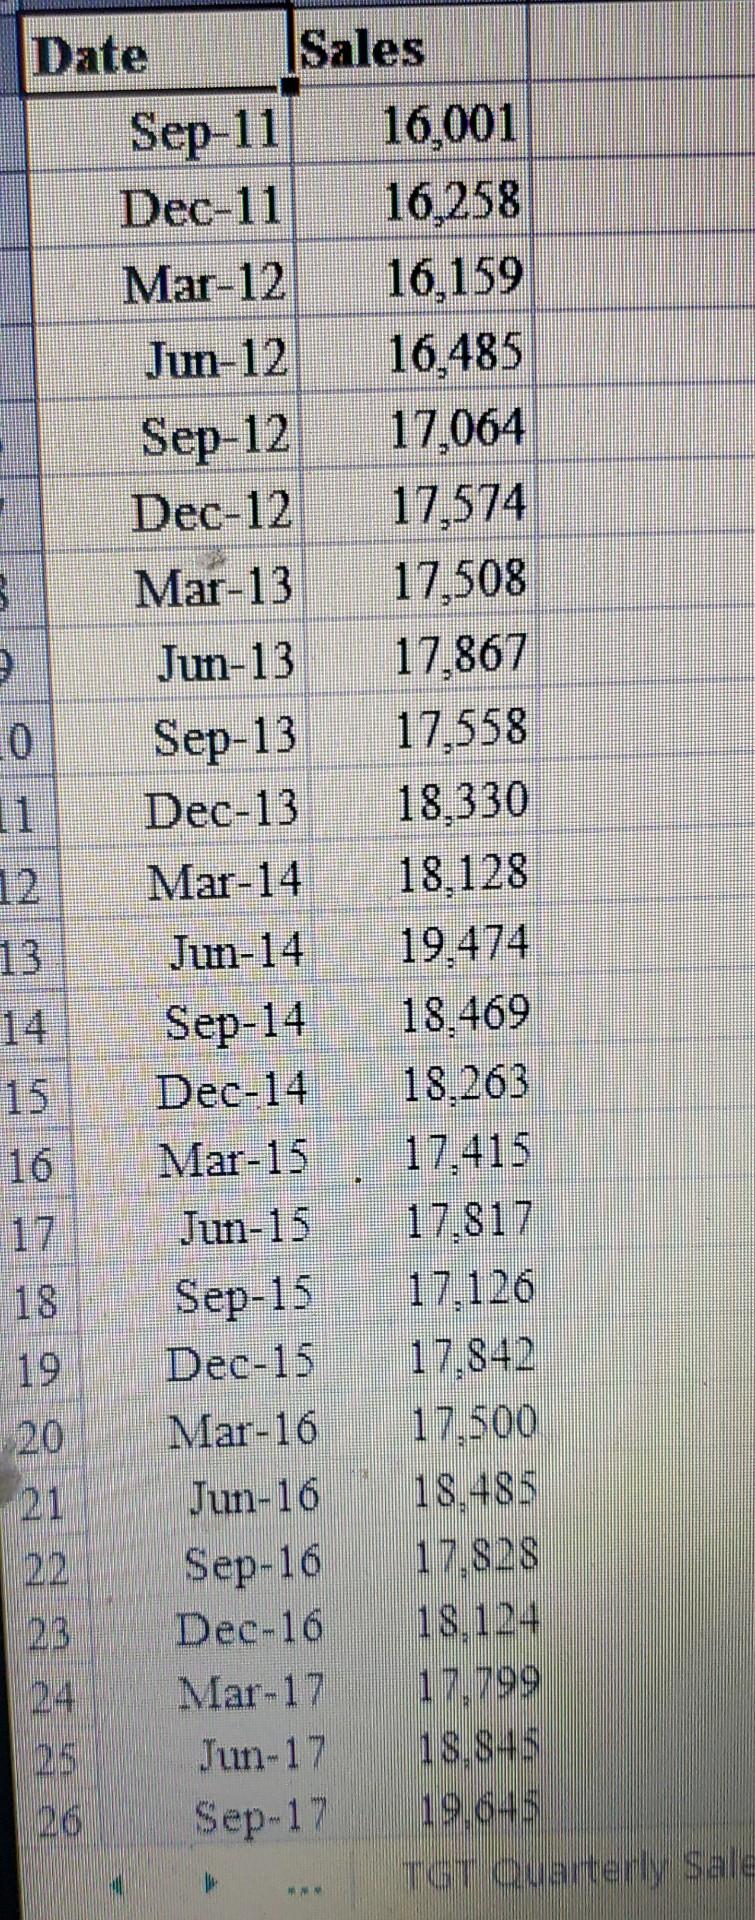
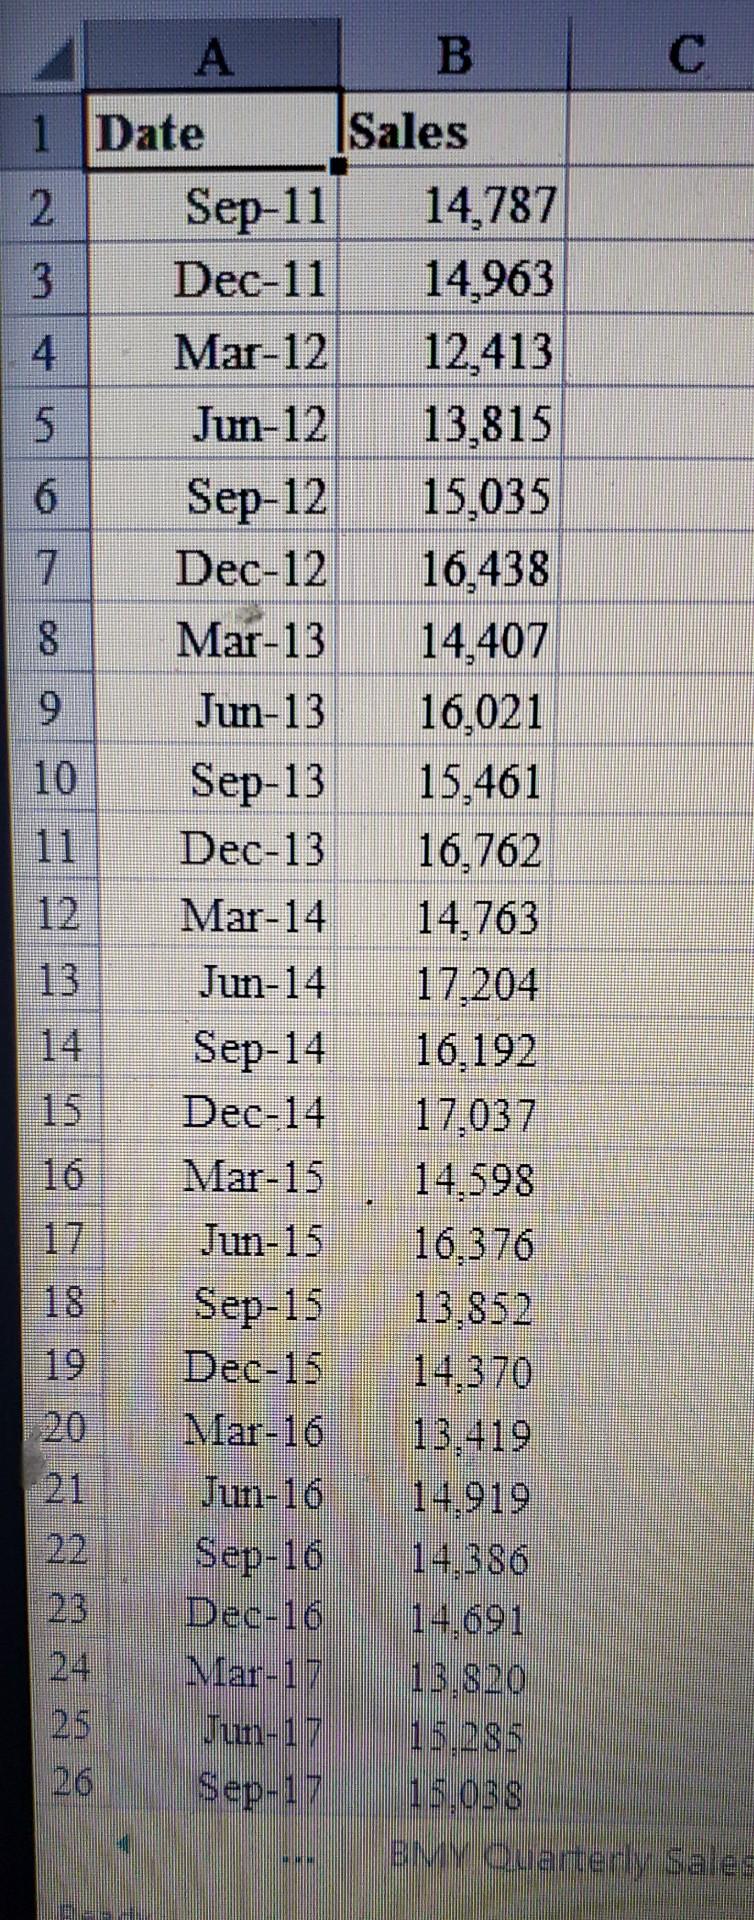
Week 3 Assignment: Chapter 6 Problem \#1 Requirement: You will complete most of your weekly assignments using Excel. These assignments will reference the concepts learned from your text, from your chapter PowerPoints, and other videos provided for you to view. Please be sure to review the chapter PowerPoints before beginning your assignments. Topic: Using the information provided in Chapter 6 Problem \#1, complete parts "a" through "c" using the provided Excel template below. Graded Activity: 1. Read Chapter 6 of your text. 2. Review the PowerPoint for Chapter 6 and any related videos provided for the week. 3. Complete Week 3 Assignment: Chapter 6 Problem \#1. Using the TGT Quarterly Sales (Target Corp.) data: a. Create a line chart of sales. Do you see a trend? Do you see any seasonality? If so, what is the frequency? b. Using the procedures detailed in the chapter, decompose the time series into the trend, seasonality, and irregular components. c. Which of the time series methodologies discussed in the chapter would likely be the most appropriate for forecasting Target's sales? \begin{tabular}{|c|c|c|} \hline 1 & Date & Sales \\ \hline 2 & Sep-11 & 10,876 \\ \hline 3 & Dec-11 & 17,431 \\ \hline 4 & Mar-12 & 13,185 \\ \hline 5 & Jun-12 & 12,834 \\ \hline 6 & Sep-12 & 13,806 \\ \hline 7 & Dec-12 & 21,268 \\ \hline 8 & Mar-13 & 16,070 \\ \hline 9 & Jun-13 & 15,704 \\ \hline 10 & Sep-13 & 17,092 \\ \hline 11 & Dec-13 & 25,587 \\ \hline 12 & Mar-14 & 19,741 \\ \hline 13 & Jun-14 & 19,340 \\ \hline 14 & Sep-14 & 20,579 \\ \hline 15 & Dec-14 & 29,328 \\ \hline 16 & Mar-15 & 22,717 \\ \hline 17 & Jun-15 & 23,185 \\ \hline 18 & Sep-15 & 25,358 \\ \hline 19 & Dec-15 & 35,747 \\ \hline 20 & Mar-16 & 29,128 \\ \hline 21 & Jun-16 & 30,404 \\ \hline 22 & Sep-16 & 32,714 \\ \hline 23 & Dec-16 & 43,741 \\ \hline 24 & Mar-17 & 35,714 \\ \hline 25 & Jun-17 & 37,955 \\ \hline 26 & Sep-17 & 43,744 \\ \hline \end{tabular} Source: Factset, Retrieved on 5242019 All figures in millions of dollars Date |Sales \begin{tabular}{|r|r|r|} \hline 2 & Oct-11 & 16,402 \\ \hline 3 & Jan-12 & 21,288 \\ \hline 4 & Apr-12 & 16,867 \\ \hline 5 & Jul-12 & 16,779 \\ \hline 6 & Oct-12 & 16,929 \\ \hline 7 & Jan-13 & 22,726 \\ \hline 8 & Apr-13 & 16,706 \\ \hline 9 & Jul-13 & 17,117 \\ \hline 10 & Oct-13 & 17,258 \\ \hline 11 & Jan-14 & 21,515 \\ \hline 12 & Apr-14 & 17,050 \\ \hline 13 & Jul-14 & 17,406 \\ \hline 14 & Oct-14 & 17,732 \\ \hline 15 & Jan-15 & 21,751 \\ \hline 16 & Apr-15 & 17,119 \\ \hline 17 & Jul-15 & 17,427 \\ 18 & Oct-15 & 17,613 \\ \hline 19 & Jan-16 & 21,626 \\ \hline 20 & Apr-16 & 16,196 \\ \hline 21 & Jul-16 & 16,169 \\ \hline 22 & Oct-16 & 16,441 \\ \hline 23 & Jan-17 & 20,690 \\ \hline 24 & Apr-17 & 16,017 \\ \hline 25 & Jul-17 & 16,429 \\ \hline 26 & Oct-17 & 16,667 \\ \hline \end{tabular} \begin{tabular}{|c|r|r|} \hline 1 & Date & Sales \\ \hline 2 & Sep-11 & 25,284 \\ \hline 3 & Dec-11 & 25,918 \\ \hline 4 & Mar-12 & 27,285 \\ \hline 5 & Jun-12 & 27,266 \\ \hline 6 & Sep-12 & 27,302 \\ \hline 7 & Dec-12 & 28,771 \\ \hline 8 & Mar-13 & 30,343 \\ \hline 9 & Jun-13 & 30,409 \\ \hline 10 & Sep-13 & 30,627 \\ \hline 11 & Dec-13 & 31,118 \\ \hline 12 & Mar-14 & 31,711 \\ \hline 13 & Jun-14 & 32,578 \\ \hline 14 & Sep-14 & 32,777 \\ \hline 15 & Dec-14 & 33,434 \\ \hline 16 & Mar-15 & 35,757 \\ 17 & Jun-15 & 36,266 \\ 18 & Sep-15 & 41,493 \\ \hline 19 & Dec-15 & 43,613 \\ \hline 20 & Mar-16 & 44,548 \\ \hline 21 & Jun-16 & 46,486 \\ \hline 22 & Sep-16 & 46,314 \\ \hline 23 & Dec-16 & 47,525 \\ \hline 24 & Mar-17 & 48,723 \\ \hline 25 & Jun-17 & 50,053 \\ \hline 26 & Sep-17 & 50,322 \\ \hline \end{tabular} \begin{tabular}{|r|r|} \hline Date & \multicolumn{1}{|l|}{ Sales } \\ \hline Sep-11 & 5,345 \\ \hline Dec-11 & 5,454 \\ \hline Mar-12 & 5,251 \\ \hline Jun-12 & 4,443 \\ \hline Sep-12 & 3,736 \\ \hline Dec-12 & 4,191 \\ \hline Mar-13 & 3,831 \\ \hline Jun-13 & 4,048 \\ \hline Sep-13 & 4,065 \\ \hline Dec-13 & 4,441 \\ Mar-14 & 3,811 \\ Jun-14 & 3,889 \\ Sep-14 & 3,921 \\ \hline Dec-14 & 4,258 \\ Mar-15 & 4,041 \\ Jun-15 & 4,163 \\ Sep-15 & 4,069 \\ Dec-15 & 4,287 \\ Mar-16 & 4,391 \\ Jun-16 & 4,871 \\ Sep-16 & 4,922 \\ Dec-16 & 5,243 \\ Mar-17 &,+ 929 \\ Jun-17 & 5,14+ \\ Sep-17 & 5,25+ \\ \hline \end{tabular} Week 3 Assignment: Chapter 6 Problem \#1 Requirement: You will complete most of your weekly assignments using Excel. These assignments will reference the concepts learned from your text, from your chapter PowerPoints, and other videos provided for you to view. Please be sure to review the chapter PowerPoints before beginning your assignments. Topic: Using the information provided in Chapter 6 Problem \#1, complete parts "a" through "c" using the provided Excel template below. Graded Activity: 1. Read Chapter 6 of your text. 2. Review the PowerPoint for Chapter 6 and any related videos provided for the week. 3. Complete Week 3 Assignment: Chapter 6 Problem \#1. Using the TGT Quarterly Sales (Target Corp.) data: a. Create a line chart of sales. Do you see a trend? Do you see any seasonality? If so, what is the frequency? b. Using the procedures detailed in the chapter, decompose the time series into the trend, seasonality, and irregular components. c. Which of the time series methodologies discussed in the chapter would likely be the most appropriate for forecasting Target's sales? \begin{tabular}{|c|c|c|} \hline 1 & Date & Sales \\ \hline 2 & Sep-11 & 10,876 \\ \hline 3 & Dec-11 & 17,431 \\ \hline 4 & Mar-12 & 13,185 \\ \hline 5 & Jun-12 & 12,834 \\ \hline 6 & Sep-12 & 13,806 \\ \hline 7 & Dec-12 & 21,268 \\ \hline 8 & Mar-13 & 16,070 \\ \hline 9 & Jun-13 & 15,704 \\ \hline 10 & Sep-13 & 17,092 \\ \hline 11 & Dec-13 & 25,587 \\ \hline 12 & Mar-14 & 19,741 \\ \hline 13 & Jun-14 & 19,340 \\ \hline 14 & Sep-14 & 20,579 \\ \hline 15 & Dec-14 & 29,328 \\ \hline 16 & Mar-15 & 22,717 \\ \hline 17 & Jun-15 & 23,185 \\ \hline 18 & Sep-15 & 25,358 \\ \hline 19 & Dec-15 & 35,747 \\ \hline 20 & Mar-16 & 29,128 \\ \hline 21 & Jun-16 & 30,404 \\ \hline 22 & Sep-16 & 32,714 \\ \hline 23 & Dec-16 & 43,741 \\ \hline 24 & Mar-17 & 35,714 \\ \hline 25 & Jun-17 & 37,955 \\ \hline 26 & Sep-17 & 43,744 \\ \hline \end{tabular} Source: Factset, Retrieved on 5242019 All figures in millions of dollars Date |Sales \begin{tabular}{|r|r|r|} \hline 2 & Oct-11 & 16,402 \\ \hline 3 & Jan-12 & 21,288 \\ \hline 4 & Apr-12 & 16,867 \\ \hline 5 & Jul-12 & 16,779 \\ \hline 6 & Oct-12 & 16,929 \\ \hline 7 & Jan-13 & 22,726 \\ \hline 8 & Apr-13 & 16,706 \\ \hline 9 & Jul-13 & 17,117 \\ \hline 10 & Oct-13 & 17,258 \\ \hline 11 & Jan-14 & 21,515 \\ \hline 12 & Apr-14 & 17,050 \\ \hline 13 & Jul-14 & 17,406 \\ \hline 14 & Oct-14 & 17,732 \\ \hline 15 & Jan-15 & 21,751 \\ \hline 16 & Apr-15 & 17,119 \\ \hline 17 & Jul-15 & 17,427 \\ 18 & Oct-15 & 17,613 \\ \hline 19 & Jan-16 & 21,626 \\ \hline 20 & Apr-16 & 16,196 \\ \hline 21 & Jul-16 & 16,169 \\ \hline 22 & Oct-16 & 16,441 \\ \hline 23 & Jan-17 & 20,690 \\ \hline 24 & Apr-17 & 16,017 \\ \hline 25 & Jul-17 & 16,429 \\ \hline 26 & Oct-17 & 16,667 \\ \hline \end{tabular} \begin{tabular}{|c|r|r|} \hline 1 & Date & Sales \\ \hline 2 & Sep-11 & 25,284 \\ \hline 3 & Dec-11 & 25,918 \\ \hline 4 & Mar-12 & 27,285 \\ \hline 5 & Jun-12 & 27,266 \\ \hline 6 & Sep-12 & 27,302 \\ \hline 7 & Dec-12 & 28,771 \\ \hline 8 & Mar-13 & 30,343 \\ \hline 9 & Jun-13 & 30,409 \\ \hline 10 & Sep-13 & 30,627 \\ \hline 11 & Dec-13 & 31,118 \\ \hline 12 & Mar-14 & 31,711 \\ \hline 13 & Jun-14 & 32,578 \\ \hline 14 & Sep-14 & 32,777 \\ \hline 15 & Dec-14 & 33,434 \\ \hline 16 & Mar-15 & 35,757 \\ 17 & Jun-15 & 36,266 \\ 18 & Sep-15 & 41,493 \\ \hline 19 & Dec-15 & 43,613 \\ \hline 20 & Mar-16 & 44,548 \\ \hline 21 & Jun-16 & 46,486 \\ \hline 22 & Sep-16 & 46,314 \\ \hline 23 & Dec-16 & 47,525 \\ \hline 24 & Mar-17 & 48,723 \\ \hline 25 & Jun-17 & 50,053 \\ \hline 26 & Sep-17 & 50,322 \\ \hline \end{tabular} \begin{tabular}{|r|r|} \hline Date & \multicolumn{1}{|l|}{ Sales } \\ \hline Sep-11 & 5,345 \\ \hline Dec-11 & 5,454 \\ \hline Mar-12 & 5,251 \\ \hline Jun-12 & 4,443 \\ \hline Sep-12 & 3,736 \\ \hline Dec-12 & 4,191 \\ \hline Mar-13 & 3,831 \\ \hline Jun-13 & 4,048 \\ \hline Sep-13 & 4,065 \\ \hline Dec-13 & 4,441 \\ Mar-14 & 3,811 \\ Jun-14 & 3,889 \\ Sep-14 & 3,921 \\ \hline Dec-14 & 4,258 \\ Mar-15 & 4,041 \\ Jun-15 & 4,163 \\ Sep-15 & 4,069 \\ Dec-15 & 4,287 \\ Mar-16 & 4,391 \\ Jun-16 & 4,871 \\ Sep-16 & 4,922 \\ Dec-16 & 5,243 \\ Mar-17 &,+ 929 \\ Jun-17 & 5,14+ \\ Sep-17 & 5,25+ \\ \hline \end{tabular}Step by Step Solution
There are 3 Steps involved in it
Step: 1

Get Instant Access to Expert-Tailored Solutions
See step-by-step solutions with expert insights and AI powered tools for academic success
Step: 2

Step: 3

Ace Your Homework with AI
Get the answers you need in no time with our AI-driven, step-by-step assistance
Get Started


