According to a recent survey of 1600 people, 65% feel that the president is doing an acceptable job. We are interested in the population proportion
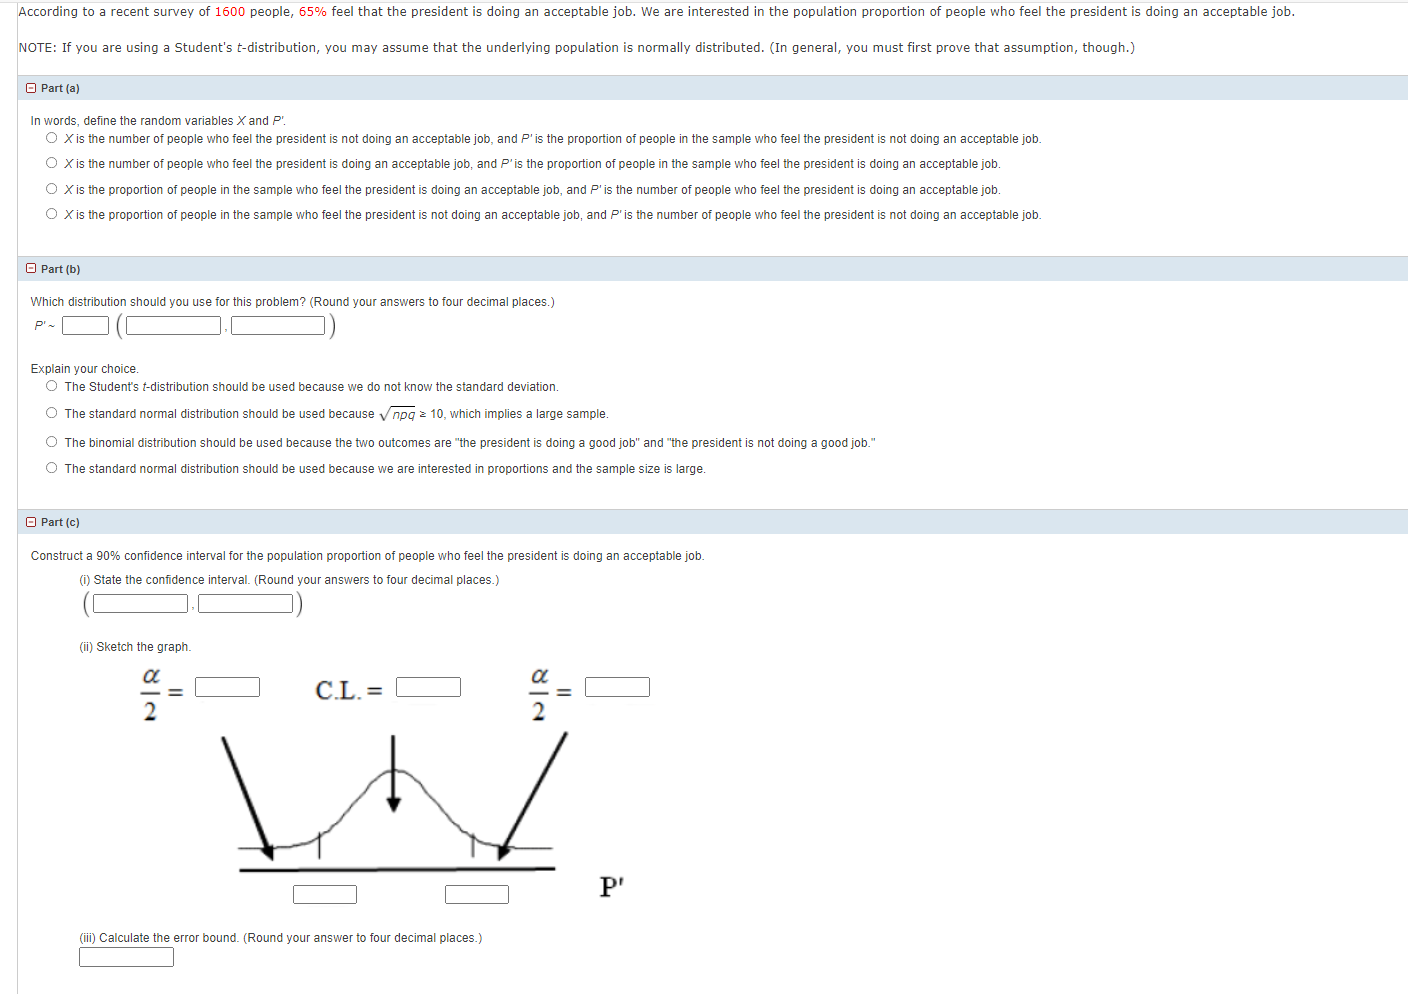
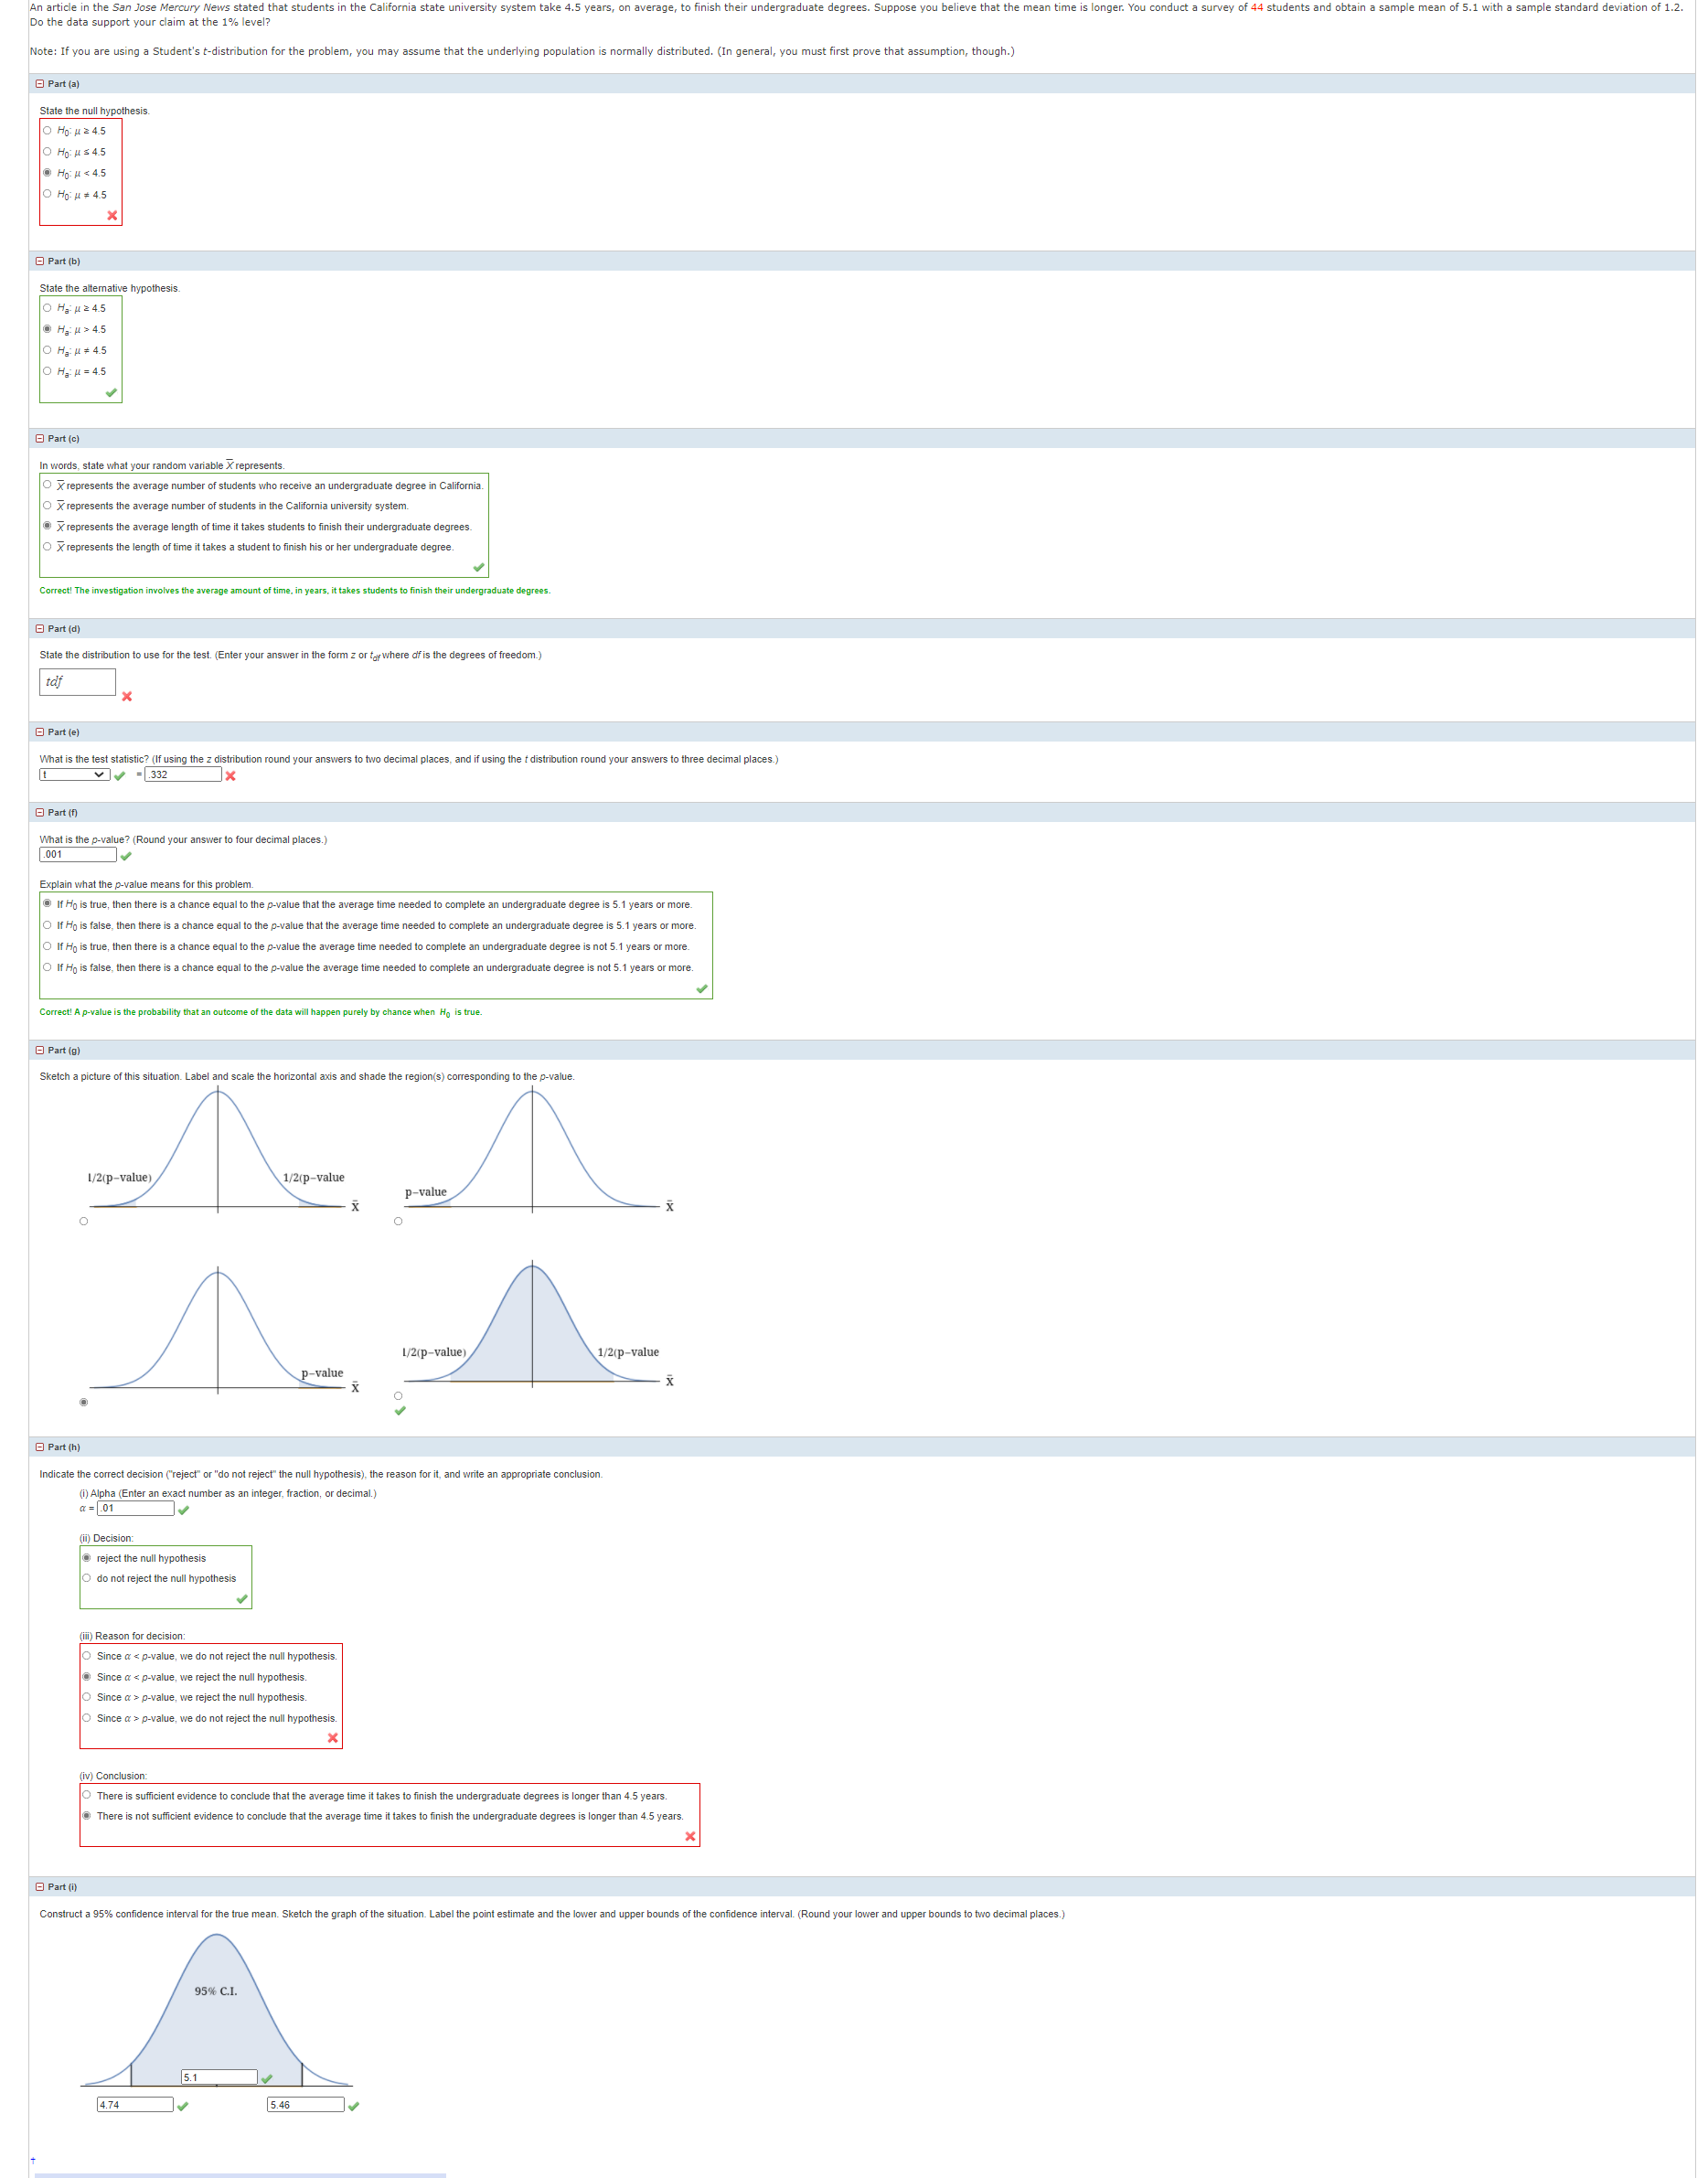
According to a recent survey of 1600 people, 65% feel that the president is doing an acceptable job. We are interested in the population proportion of people who feel the president is doing an acceptable job. NOTE: If you are using a Student's t-distribution, you may assume that the underlying population is normally distributed. (In general, you must first prove that assumption, though.) Part (a) In words, define the random variables X and P: O X is the number of people who feel the president is not doing an acceptable job, and P' is the proportion of people in the sample who feel the president is not doing an acceptable job. O X is the number of people who feel the president is doing an acceptable job, and P'is the proportion of people in the sample who feel the president is doing an acceptable job. O X is the proportion of people in the sample who feel the president is doing an acceptable job, and P' is the number of people who feel the president is doing an acceptable job. O X is the proportion of people in the sample who feel the president is not doing an acceptable job, and P' is the number of people who feel the president is not doing an acceptable job Part (b) Which distribution should you use for this problem? (Round your answers to four decimal places.) Explain your choice. O The Student's f-distribution should be used because we do not know the standard deviation. The standard normal distribution should be used because v npq > 10, which implies a large sample. The binomial distribution should be used because the two outcomes are "the president is doing a good job" and "the president is not doing a good job." The standard normal distribution should be used because we are interested in proportions and the sample size is large. Part (c) Construct a 90% confidence interval for the population proportion of people who feel the president is doing an acceptable job. (i) State the confidence interval. (Round your answers to four decimal places.) (ii) Sketch the graph. OL C.L. = = P' (ii) Calculate the error bound. (Round your answer to four decimal places.)An article Note: If you are using a Student's t-distribution for the problem, you may I, you must first prove that assumption, though.) Part (a ) State the null hypothesis . O HO: H 2 4.5 O HO : M = 4.5 HO: H = 4.5 O HO: H # 4.5 Part ( b ) State the alternative hypothesis. O Ha: H 2 4.5 . Ha H > 4.5 O HE: H # 4.5 O Hail = 4.5 Part ( c ) in words. state what your random variable X represents. O X represents the average ber of students who receive an undergraduate degree in California. * represents the average number of students in the California university system. . * represents the average length of time it takes students to finish their undergraduate degrees. . * represents the length of time it takes a student to finish his or her undergraduate degree. Correct ! The investigation involves the average amount of time, in years, it takes students to finish their undergraduate degrees. Part (d) State the distribution to use for the test. (Enter your n z of tay where off is the degrees of freedom.) tdf Part ( e ) What is the test statistic? (If using the z distribution round your an vy = 332 cimal places, and if using the t distribution rour X ( Part ( 1) What is the p-value? (Round your answer to four decimal places.) Explain what the p-value means for this problem. . If Ho is true, then there is a p-value that the ave undergraduate degree is 5.1 years or more. O If Ho is false, then there is a chance ergraduate degree is 5.1 years or more. O If Ho is true, then there is a chance equal to the p-value the average time n te an undergraduate degree is not 5.1 years or more. O If Ho is false, then th ate an undergraduate degree is not 5.1 years or more. Correct! A p-value is the probability that a n purely by chance when He is true Part (9) Sketch a picture of this situation. Label and scale the horizontal axis and shade the region(s) corresponding to the p-value 1/2(p-value) 1/2(p-value p-value 1/2(p-value 1/2(p-value p-value Part (h) Indicate the correct decision ('reject" or "do not reject" the null hypothesis), the reason for it, and write an appropriate conclusion. (1) Alpha (Enter an exact number as an integer, fraction, or decimal.) a = 01 (i) Decision: . reject the null hypothesis do not reject the null hypothesis (il) Reason for decision: Since a p-value, we reject the null hypothesis. O Since a > p-value, we do not reject the null hypothesis. (iv) Conclusion: There is sufficient evidence to conclude that the average time it takes to finish the ger than 4.5 years. . There is not sufficient evidence to conclud agrees is longer than 4.5 years. Part (1 ) Construct a 95% confidence interval for the true mean . Sketch the graph of the 95% C.I. 4.74 5.46
Step by Step Solution
There are 3 Steps involved in it
Step: 1
Get Instant Access to Expert-Tailored Solutions
See step-by-step solutions with expert insights and AI powered tools for academic success
Step: 2
Step: 3
Ace Your Homework with AI
Get the answers you need in no time with our AI-driven, step-by-step assistance