

Answered step by step
Verified Expert Solution
Question
1 Approved Answer
According to the following Figure, please answer a, b and c: Price CH T b--- a 1 { U S D Quantity a) In
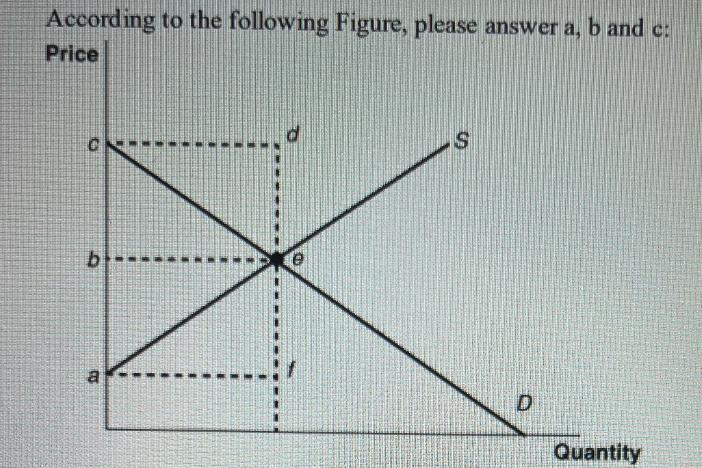
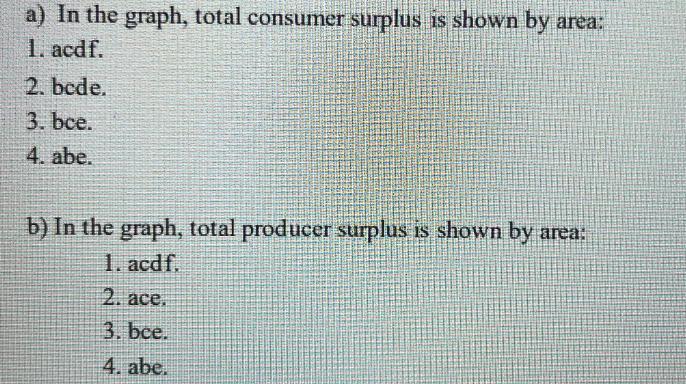
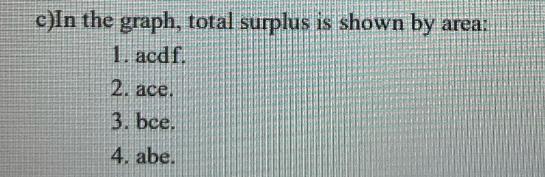
According to the following Figure, please answer a, b and c: Price CH T b--- a 1 { U S D Quantity a) In the graph, total consumer surplus is shown by area: 1. acdf. 2 bede. 3. bce. 4. abe. b) In the graph, total producer surplus is shown by area: 1. acdf. 2. ace. 3. bce. 4. abe. c)In the graph, total surplus is shown by area: 1. acdf. 2. ace. 3. bce. 4. abe.
Step by Step Solution
There are 3 Steps involved in it
Step: 1
The detailed answer for the above question is provided below a Total consumer surplus is ...
Get Instant Access to Expert-Tailored Solutions
See step-by-step solutions with expert insights and AI powered tools for academic success
Step: 2

Step: 3
Ace Your Homework with AI
Get the answers you need in no time with our AI-driven, step-by-step assistance
Get Started
Income Tax Fundamentals 2013
Authors: Gerald E. Whittenburg, Martha Altus Buller, Steven L Gill
31st Edition
1111972516, 978-1285586618, 1285586611, 978-1285613109, 978-1111972516