Answered step by step
Verified Expert Solution
Question
1 Approved Answer
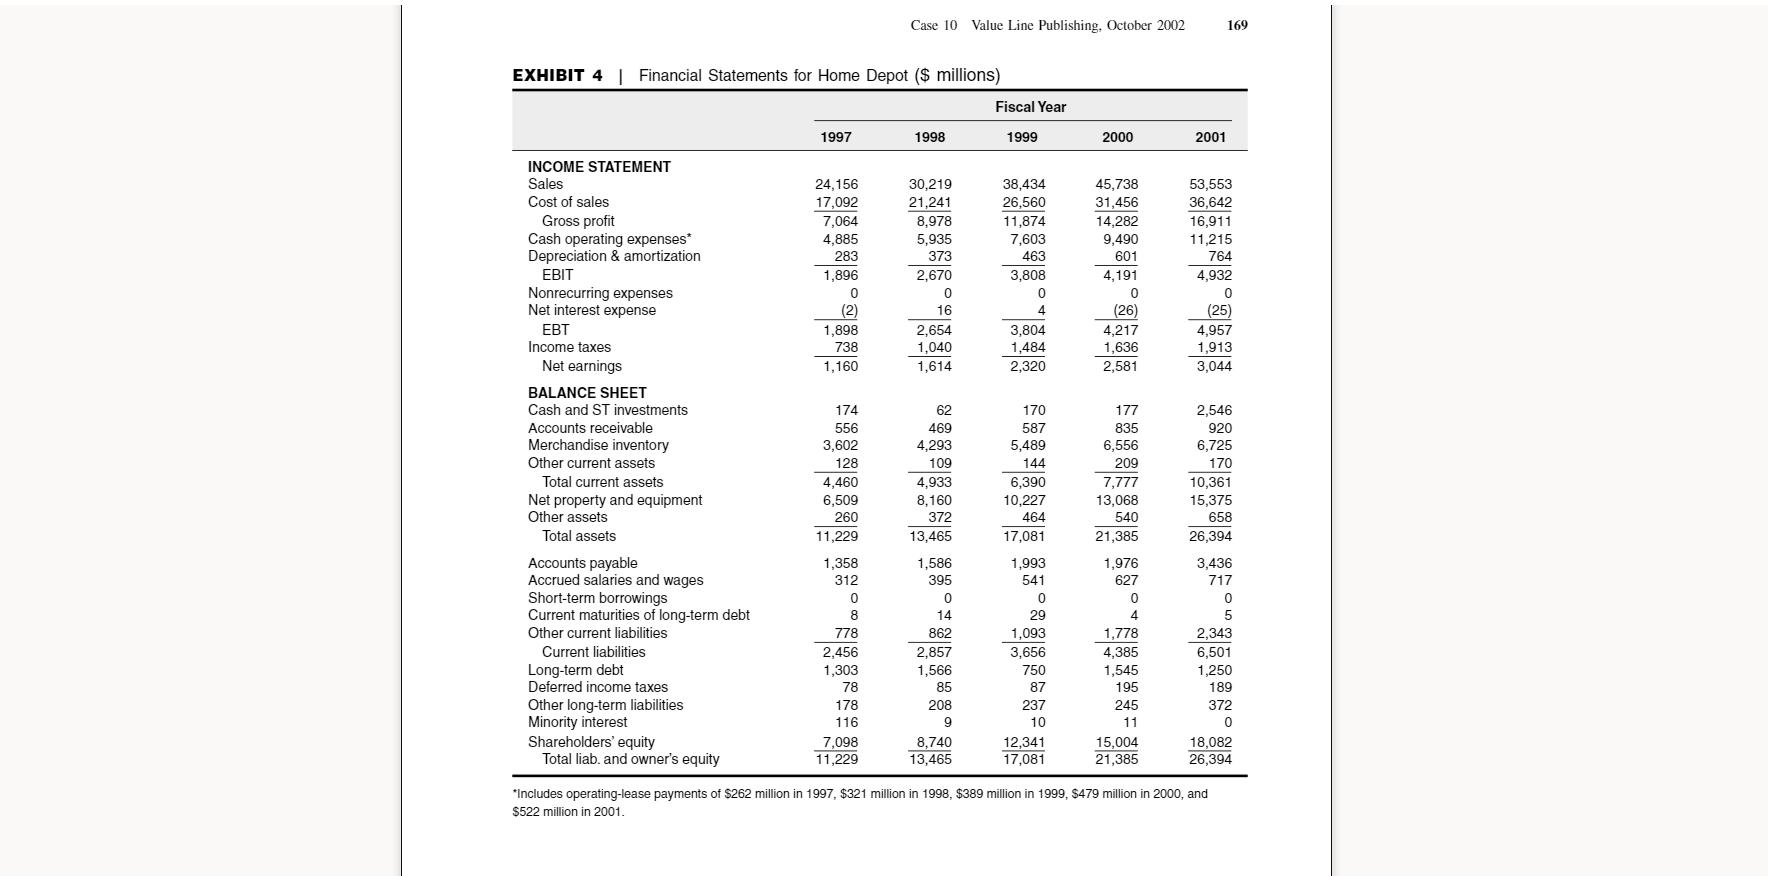
1. Ratio analysis with detailed steps of the financial statements of home depot. 2. Interpretations of the ratio analysis. Case 10 Value Line Publishing, October
1. Ratio analysis with detailed steps of the financial statements of home depot.
2. Interpretations of the ratio analysis.

Case 10 Value Line Publishing, October 2002 169 EXHIBIT 4 Financial Statements for Home Depot ($ millions) Fiscal Year 1997 1998 1999 2000 2001 INCOME STATEMENT Sales Cost of sales Gross profit Cash operating expenses* Depreciation & amortization 30,219 21,241 8,978 5,935 24,156 38,434 26,560 45,738 31,456 53,553 36,642 17,092 7,064 4,885 11,874 7,603 14,282 16,911 9,490 11,215 283 373 463 601 764 EBIT 1,896 2,670 3,808 4,191 4,932 Nonrecurring expenses Net interest expense (2) 16 4 (26) (25) T 1,898 2,654 3,804 1,484 2,320 4,217 1,636 4,957 1,913 Income taxes 738 1,040 Net earnings 1,160 1,614 2,581 3,044 BALANCE SHEET Cash and ST investments 174 62 170 177 2,546 Accounts receivable 556 469 587 835 920 Merchandise iventory 3,602 4,293 5,489 6,556 6,725 Other current assets 128 109 144 209 170 Total current assets 4,460 6,509 4,933 8,160 6,390 10,227 10,361 15,375 658 7,777 Net property and equipment Other assets 13,068 260 372 464 540 Total assets 11,229 13,465 17,081 21,385 26,394 Accounts payable Accued salaries and wages Short-term borrowings Current maturities of long-term debt 1,358 1,586 1,993 1,976 3,436 312 395 541 627 717 8 14 29 4. Other current liabilities 778 862 1,093 1,778 2,343 Current liabilities Long-term debt Deferred income taxes 2,456 2,857 3,656 4,385 6,501 1,303 1,566 750 1,545 1,250 78 85 87 195 189 Other long-term liabilities Minority interest Shareholders' equity Total liab, and owner's equity 178 208 237 245 372 116 9 10 11 7,098 11,229 8,740 13,465 18,082 26,394 12,341 15,004 21.385 17,081 *Includes operating-lease payments of $262 million in 1997, $321 million in 1998, $389 million in 1999, $479 million in 2000, and $522 million in 2001.
Step by Step Solution
★★★★★
3.46 Rating (153 Votes )
There are 3 Steps involved in it
Step: 1
Answer 1997 1998 1999 2000 2001 INCOME STATEMENT Sales 24156 30219 38434 45738 53553 Cost of sales 17092 21241 26560 31456 36642 Gross profit 7064 8978 11874 14282 16911 Cash operating expenses 4885 5...
Get Instant Access to Expert-Tailored Solutions
See step-by-step solutions with expert insights and AI powered tools for academic success
Step: 2

Step: 3

Ace Your Homework with AI
Get the answers you need in no time with our AI-driven, step-by-step assistance
Get Started


