Accounting 101


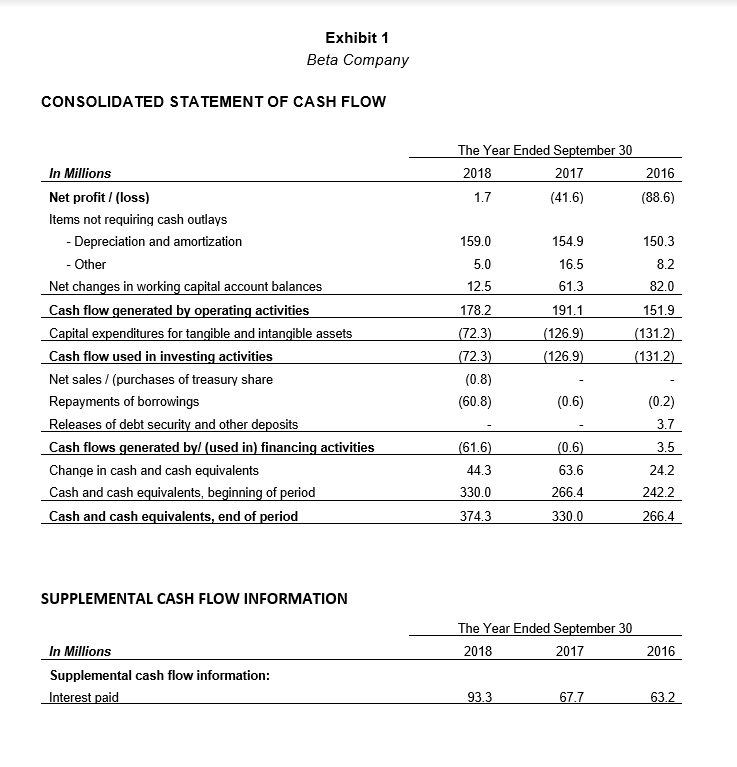
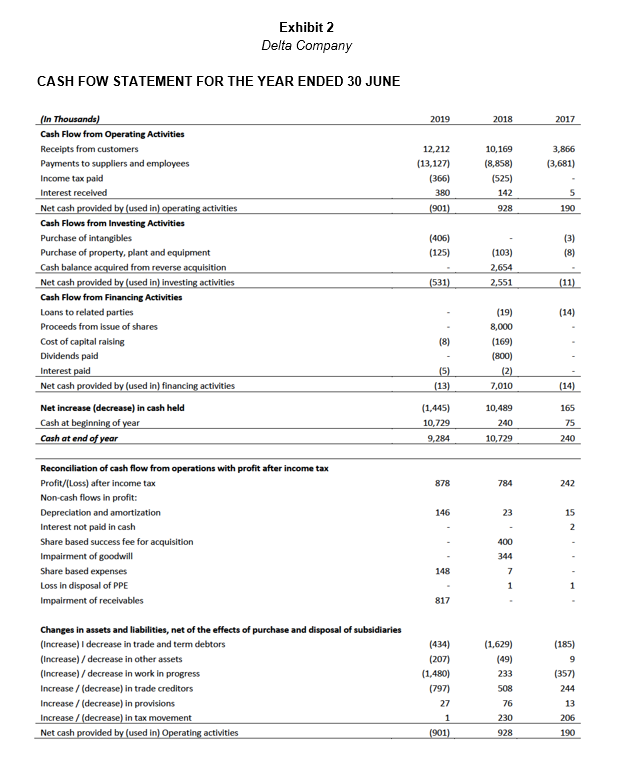
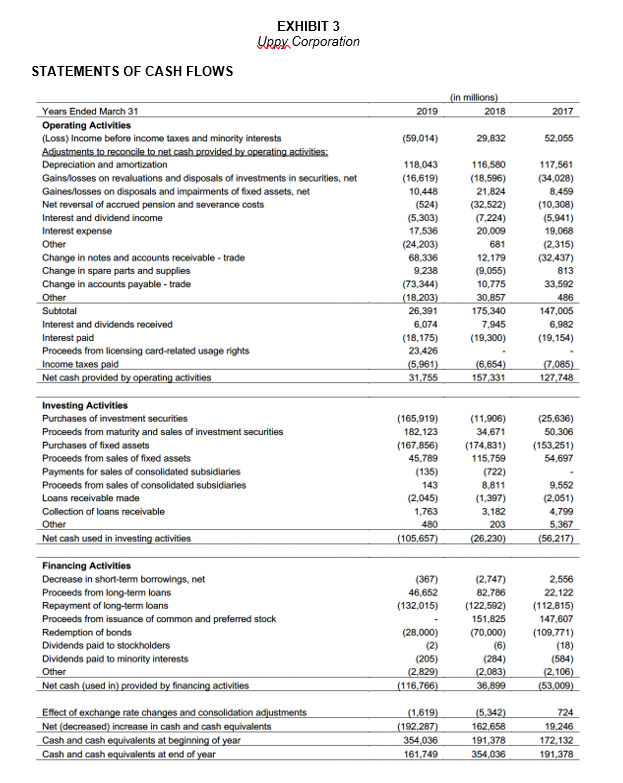
Exhibits 1, 2, and 3 contain the statements of cash flows for Beta Company, Delta Group, and Uppy Corporation, respectively. These three entities, whose real names have been disguised, come from different countries as well as different sectors of the economy. Each statement provides three years of comparable data. Examine the statements carefully with a view to arriving at an overall assessment of each company's financial situation by answering the following questions for each firm in turn: 1. Were working capital accounts (i.e., current assets and liabilities), other than cash and cash equivalents, mainly sources or uses of cash? 2. Was the company a net borrower or a net repayer of debt? 3. Did any other major items affect cash flows? Exhibit 1 Beta Company CONSOLIDATED STATEMENT OF CASH FLOW The Year Ended September 30 2018 2017 1.7 (41.6) 2016 (88.6) 159.0 150.3 8.2 82.0 In Millions Net profit / (loss) Items not requiring cash outlays - Depreciation and amortization - Other Net changes in working capital account balances Cash flow generated by operating activities Capital expenditures for tangible and intangible assets Cash flow used in investing activities Net sales / (purchases of treasury share Repayments of borrowings Releases of debt security and other deposits Cash flows generated byl (used in) financing activities Change in cash and cash equivalents Cash and cash equivalents, beginning of period Cash and cash equivalents, end of period 5.0 12.5 178.2 (72.3) (72.3) (0.8) (60.8) 154.9 16.5 61.3 191.1 (126.9) (126.9) 151.9 (131.2) (131.2) (0.6) (0.2) 3.7 3.5 (61.6) 44.3 330.0 (0.6) 63.6 266.4 24.2 242.2 374.3 330.0 266.4 SUPPLEMENTAL CASH FLOW INFORMATION The Year Ended September 30 2018 2017 2016 In Millions Supplemental cash flow information: Interest paid 93.3 67.7 63.2 Exhibit 2 Delta Company CASH FOW STATEMENT FOR THE YEAR ENDED 30 JUNE 2019 2018 2017 12,212 (13,127) (366) 380 3,866 (3,681) 10,169 (8,858) (525) 142 928 5 (901) 190 (406) (125) (3) (8) (In Thousands) Cash Flow from Operating Activities Receipts from customers Payments to suppliers and employees Income tax paid Interest received Net cash provided by (used in) operating activities Cash Flows from Investing Activities Purchase of intangibles Purchase of property, plant and equipment Cash balance acquired from reverse acquisition Net cash provided by (used in) investing activities Cash Flow from Financing Activities Loans to related parties Proceeds from Issue of shares Cost of capital raising Dividends paid Interest paid Net cash provided by (used in) financing activities Net increase (decrease) in cash held Cash at beginning of year Cash at end of year (103) 2,654 2,551 (531) (11) (14) (8) (19) 8,000 (169) (800) (2) 7,010 (5) (13) (14) (1.445) 10,729 9,284 10,489 240 165 75 10,729 240 878 784 242 146 23 15 2 Reconciliation of cash flow from operations with profit after income tax Profit/(Loss) after income tax Non-cash flows in profit: Depreciation and amortization Interest not paid in cash Share based success fee for acquisition Impairment of goodwill Share based expenses Loss in disposal of PPE Impairment of receivables 400 344 148 7 1 817 Changes in assets and liabilities, net of the effects of purchase and disposal of subsidiaries (Increase) I decrease in trade and term debtors (Increase)/ decrease in other assets (Increase)/ decrease in work in progress Increase / (decrease) in trade creditors Increase / (decrease) in provisions Increase / (decrease) in tax movement Net cash provided by (used in) Operating activities (434) (207) (1,480) (797) 27 1 (901) (1.629) (49) 233 508 76 230 928 (185) 9 (357) 244 13 206 190 EXHIBIT 3 Urry Corporation STATEMENTS OF CASH FLOWS (in millions) 2018 2019 2017 (59,014) 29,832 52,055 118,043 (16,619) 10.448 (524) (5,303) 17.536 (24,203) 68,336 9.238 (73,344) (18,203) 26.391 6,074 (18.175) 23.426 (5,961) 31.755 116,580 (18,596) 21.824 (32.522) (7.224) 20.009 681 12,179 (9.055) 10.775 30.857 175,340 7.945 (19,300) 117,561 (34,028) 8.459 (10,308) (5.941) 19.068 (2,315) (32.437) 813 33,592 486 147,005 6.982 (19,154) (6,654) 157331 7085) 127,748 Years Ended March 31 Operating Activities (Loss) Income before income taxes and minority interests Adjustments to reconcile to net cash provided by operating activities: Depreciation and amortization Gains/losses on revaluations and disposals of investments in securities, net Gaines/losses on disposals and impairments of fixed assets, net Net reversal of accrued pension and severance costs Interest and dividend income Interest expense Other Change in notes and accounts receivable - trade Change in spare parts and supplies Change in accounts payable - trade Other Subtotal Interest and dividends received Interest paid Proceeds from licensing card-related usage rights Income taxes paid Net cash provided by operating activities Investing Activities Purchases of investment securities Proceeds from maturity and sales of investment securities Purchases of fixed assets Proceeds from sales of fixed assets Payments for sales of consolidated subsidiaries Proceeds from sales of consolidated subsidiaries Loans receivable made Collection of loans receivable Other Net cash used in investing activities Financing Activities Decrease in short-term borrowings, net Proceeds from long-term loans Repayment of long-term loans Proceeds from issuance of common and preferred stock Redemption of bonds Dividends paid to stockholders Dividends paid to minority Interests Other Net cash (used in) provided by financing activities Effect of exchange rate changes and consolidation adjustments Net (decreased) increase in cash and cash equivalents Cash and cash equivalents at beginning of year Cash and cash equivalents at end of year (25,636) 50,306 (153,251) 54,697 (165,919) 182,123 (167,856) 45.789 (135) 143 (2,045) 1.763 480 (105,657) (11.906) 34.671 (174,831) 115.759 (722) 8.811 (1.397) 3,182 9,552 (2,051) 4.799 5,367 (56.217) 203 (26.230) (367) 46,652 (132,015) (28,000) (2.747) 82.786 (122,592) 151.825 (70,000) (6) (284) (2,083) 36,899 2.556 22.122 (112,815) 147.607 (109.771) (18) (584) (2.106) (53,009) (2) (205) (2.829) (116,766) (1,619) (192.287) 354,036 161.749 (5,342) 162.658 191,378 354.036 724 19.246 172.132 191,378


