Question: 2. Select 3 ratios that were discussed in Appendix D. (NOTE: A complete listing of the ratios is located in Exhibit D-8 which includes
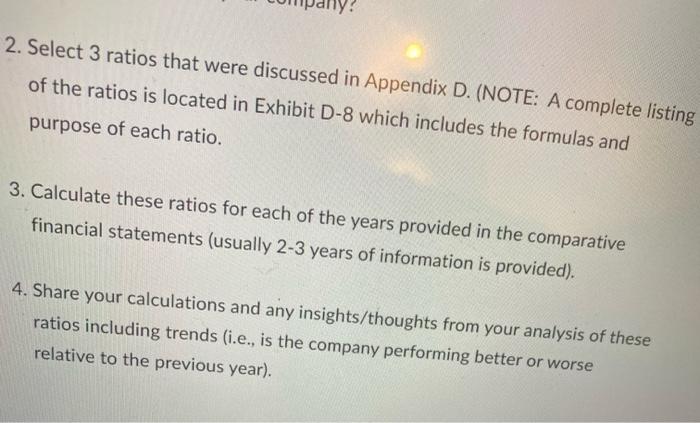
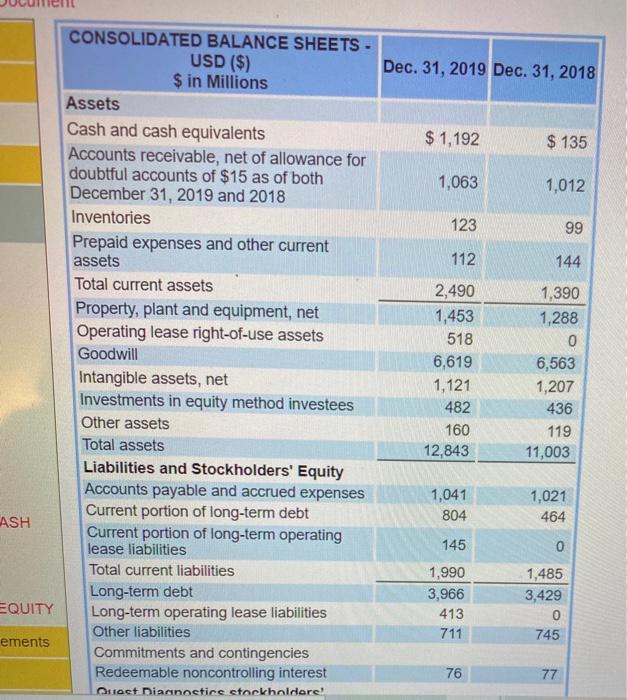
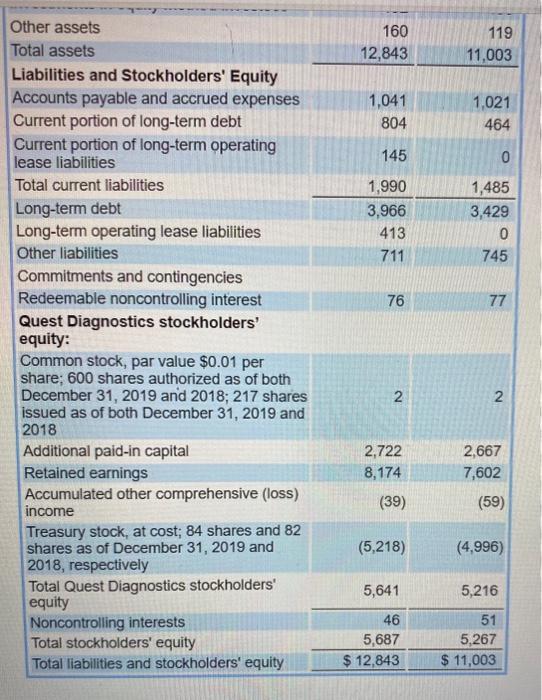
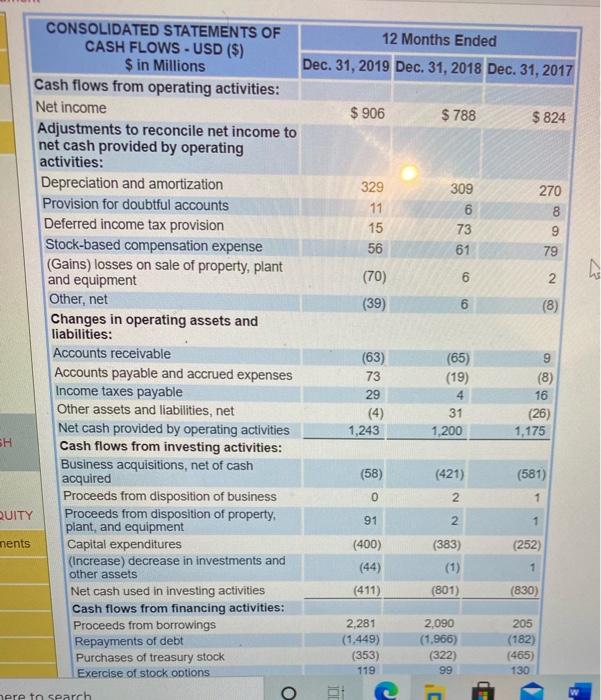
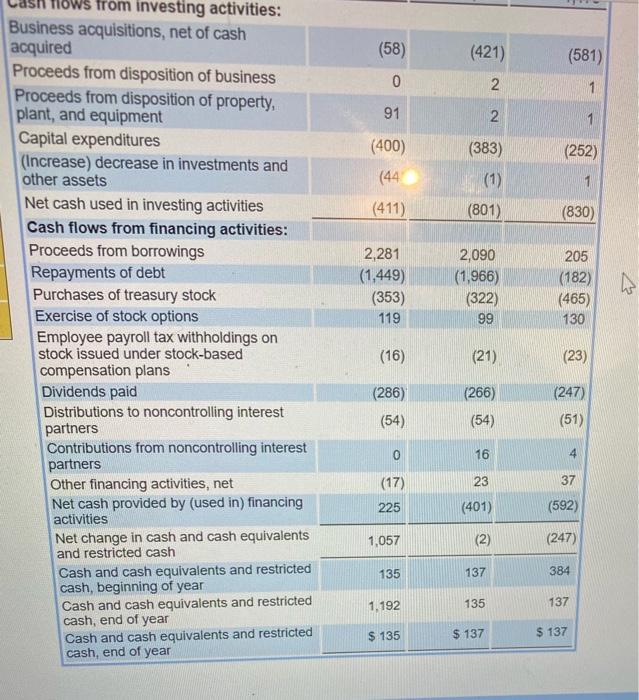
2. Select 3 ratios that were discussed in Appendix D. (NOTE: A complete listing of the ratios is located in Exhibit D-8 which includes the formulas and purpose of each ratio. 3. Calculate these ratios for each of the years provided in the comparative financial statements (usually 2-3 years of information is provided). 4. Share your calculations and any insights/thoughts from your analysis of these ratios including trends (i.e., is the company performing better or worse relative to the previous year). Cash ratio Acid-test ratio Current ratio Cash + Cash equivalents Total current liabilities The company s ability to pay current liabilities from cash and cash equivalents. Cash including cash equivalents + Short-term investments + Net current receivables The company s ability to pay all its current Total current liabilities liabilities if they came due immediately. Total current assets Total current liabilities The company s ability to pay current. liabilities from current assets. ASH EQUITY ements CONSOLIDATED BALANCE SHEETS - USD ($) $ in Millions Assets Cash and cash equivalents Accounts receivable, net of allowance for doubtful accounts of $15 as of both December 31, 2019 and 2018 Inventories Prepaid expenses and other current assets Total current assets Property, plant and equipment, net Operating lease right-of-use assets Goodwill Intangible assets, net Investments in equity method investees Other assets Total assets Liabilities and Stockholders Equity Accounts payable and accrued expenses Current portion of long-term debt Current portion of long-term operating lease liabilities Total current liabilities Long-term debt Long-term operating lease liabilities Other liabilities Commitments and contingencies Redeemable noncontrolling interest Quest Diagnostics stockholders! Dec. 31, 2019 Dec. 31, 2018 $1,192 1,063 123 112 2,490 1,453 518 6,619 1,121 482 160 12,843 1,041 804 145 1,990 3,966 413 711 76 $135 1,012 144 1,390 1,288 0 6,563 1,207 436 119 11,003 99 1,021 464 0 1,485 3,429 0 745 77 Other assets Total assets Liabilities and Stockholders Equity Accounts payable and accrued expenses Current portion of long-term debt Current portion of long-term operating lease liabilities Total current liabilities Long-term debt Long-term operating lease liabilities Other liabilities Commitments and contingencies Redeemable noncontrolling interest Quest Diagnostics stockholders equity: Common stock, par value $0.01 per share; 600 shares authorized as of both December 31, 2019 and 2018; 217 shares issued as of both December 31, 2019 and 2018 Additional paid-in capital Retained earnings Accumulated other comprehensive (loss) income Treasury stock, at cost; 84 shares and 82 shares as of December 31, 2019 and 2018, respectively Total Quest Diagnostics stockholders equity Noncontrolling interests Total stockholders equity Total liabilities and stockholders equity 160 12,843 1,041 804 145 1,990 3,966 413 711 76 2 2,722 8,174 (39) (5,218) 5,641 46 5,687 $ 12,843 119 11,003 1,021 464 0 1,485 3,429 0 745 77 2 2,667 7,602 (59) (4,996) 5,216 51 5,267 $ 11,003 SH QUITY ments CONSOLIDATED STATEMENTS OF CASH FLOWS- USD ($) $ in Millions Cash flows from operating activities: Net income Adjustments to reconcile net income to net cash provided by operating activities: Depreciation and amortization Provision for doubtful accounts Deferred income tax provision Stock-based compensation expense (Gains) losses on sale of property, plant and equipment Other, net Changes in operating assets and liabilities: Accounts receivable Accounts payable and accrued expenses Income taxes payable Other assets and liabilities, net Net cash provided by operating activities Cash flows from investing activities: Business acquisitions, net of cash acquired Proceeds from disposition of business Proceeds from disposition of property. plant, and equipment Capital expenditures (Increase) decrease in investments and other assets Net cash used in investing activities Cash flows from financing activities: Proceeds from borrowings Repayments of debt Purchases of treasury stock Exercise of stock options here to search O 12 Months Ended Dec. 31, 2019 Dec. 31, 2018 Dec. 31, 2017 $ 906 329 11 15 56 (70) (39) (63) 73 29 (4) 1,243 (58) 0 91 (400) (44) (411) 2,281 (1.449) (353) 119 $ 788 309 6 73 61 6 (65) (19) 4 31 1,200 2,090 (1,966) (322) 99 C 6 (421) 2 2 (383) (1) (801) $824 270 1,175 1 79 9 (8) 16 (26) (581) 1 (252) 1 (830) 205 (182) (465) 130 869 (8) 2 h flows from investing activities: Business acquisitions, net of cash acquired Proceeds from disposition of business Proceeds from disposition of property, plant, and equipment Capital expenditures (Increase) decrease in investments and other assets Net cash used in investing activities Cash flows from financing activities: Proceeds from borrowings Repayments of debt Purchases of treasury stock Exercise of stock options Employee payroll tax withholdings on stock issued under stock-based compensation plans Dividends paid Distributions to noncontrolling interest partners Contributions from noncontrolling interest partners Other financing activities, net Net cash provided by (used in) financing activities Net change in cash and cash equivalents and restricted cash Cash and cash equivalents and restricted cash, beginning of year Cash and cash equivalents and restricted cash, end of year Cash and cash equivalents and restricted cash, end of year (58) 0 91 (400) (44 (411) 2,281 (1,449) (353) 119 (16) (286) (54) 0 (17) 225 1,057 135 1,192 $ 135 (421) 2 2 (383) (1) (801) 2,090 (1,966) (322) 99 (21) (266) (54) 16 23 (401) (2) 137 135 $ 137 (581) 1 (252) (830) 205 (182) (465) 130 (23) (247) (51) 4 37 (592) (247) 1 384 137 $ 137 4
Step by Step Solution
3.68 Rating (171 Votes )
There are 3 Steps involved in it
Question 2019 2018 Cash Ratio Cash Cash Equivalent Current Liabilities Cash Ratio for 2019 1192 ... View full answer

Get step-by-step solutions from verified subject matter experts


