Answered step by step
Verified Expert Solution
Question
1 Approved Answer
A recent study found that American consumers are making average monthly debt payments of around $1,000 (Source: Experian.com, November 11, 2010). However, the study


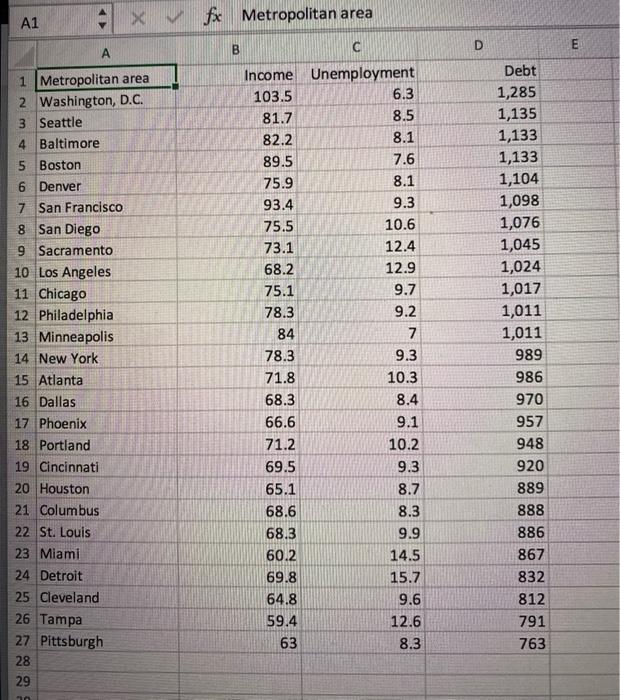
A recent study found that American consumers are making average monthly debt payments of around $1,000 (Source: Experian.com, November 11, 2010). However, the study of 26 metropolitan areas reveals quite a bit of variation in debt payments, depending on where the consumer lives. For instance, in Washington DC, residents pay the most ($1,285 per month), while Pittsburgh residents pay the least ($763 per month). Madelyn Davis, an economist in a large bank, believes that income differences between cities are the primary reason for the disparate debt payments. For example, Washington DC's high incomes have likely contributed to it placement on the list. She is also unsure about the likely effect of unemployment rate on consumer debt payments. In order to analyze the relationship between income, unemployment rate, and consumer debt payments, Madelyn collected data from the same 26 metropolitan cities used in the earlier debt payment study. Specifically, she gathered each area's 2010 - 2011 median household income (recorded in thousands of dollars) as well as the monthly unemployment rate and average consumer debt for August 2010. The Excel file Debt_Payments.xlsx has the data. A1 A x v fx Metropolitan area Debt Income Unemployment 6.3 1 Metropolitan area 2 Washington, D.C. 3 Seattle 103.5 1,285 81.7 8.5 1,135 82.2 8.1 1,133 4 Baltimore 5 Boston 1,133 1,104 1,098 89.5 7.6 75.9 8.1 6 Denver 7 San Francisco 93.4 9.3 75.5 10.6 1,076 8 San Diego 9 Sacramento 73.1 12.4 1,045 68.2 12.9 1,024 10 Los Angeles 11 Chicago 12 Philadelphia 13 Minneapolis 14 New York 1,017 1,011 75.1 9.7 78.3 9.2 84 7 1,011 78.3 9.3 989 15 Atlanta 71.8 10.3 986 16 Dallas 68.3 8.4 970 66.6 9.1 957 17 Phoenix 18 Portland 71.2 10.2 948 19 Cincinnati 69.5 9.3 920 20 Houston 65.1 8.7 889 21 Columbus 22 St. Louis 23 Miami 68.6 8.3 888 68.3 9.9 886 60.2 14.5 867 24 Detroit 69.8 15.7 832 25 Cleveland 26 Tampa 27 Pittsburgh 64.8 9.6 812 59.4 12.6 791 63 8.3 763 28 29 Apply the statistical methods to answer both research questions a. Follow all steps required to conduct a complete analysis and validation of methods, including assumption checks Presentation of the results and their interpretations a. If using multiple models, perform a comparison to select the best one. Justify your choice. Final conclusions, decision-making and recommendations based on the results to the economist
Step by Step Solution
★★★★★
3.47 Rating (163 Votes )
There are 3 Steps involved in it
Step: 1
Solution a Describe the problem background and purpose of the study understand the relationships bet...
Get Instant Access to Expert-Tailored Solutions
See step-by-step solutions with expert insights and AI powered tools for academic success
Step: 2

Step: 3

Ace Your Homework with AI
Get the answers you need in no time with our AI-driven, step-by-step assistance
Get Started


