Answered step by step
Verified Expert Solution
Question
1 Approved Answer
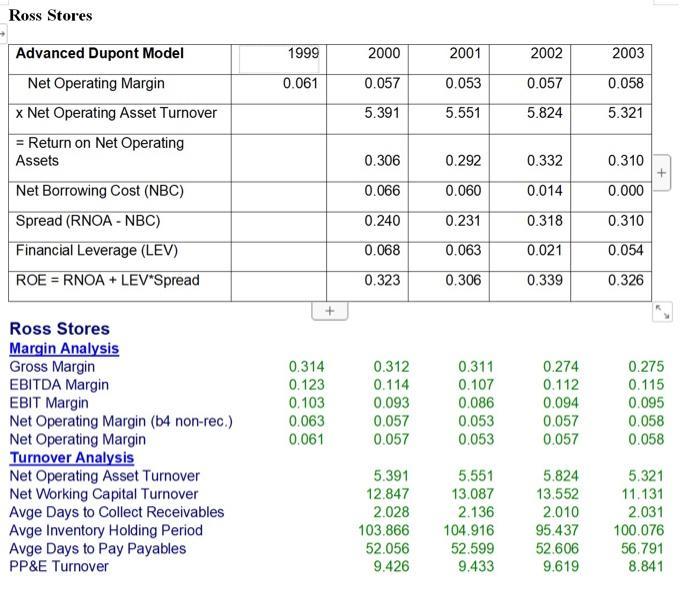
Ross Stores Advanced Dupont Model 1999 2000 2001 2002 2003 Net Operating Margin 0.061 0.057 0.053 0.057 0.058 Net Operating Asset Turnover 5.391 5.551


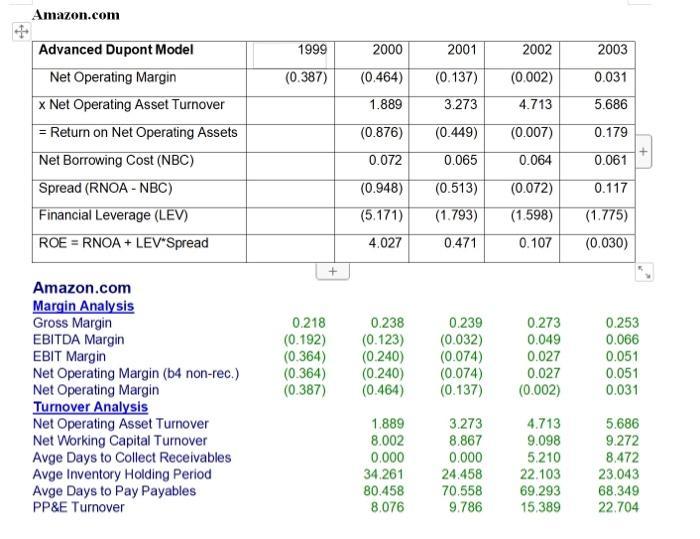
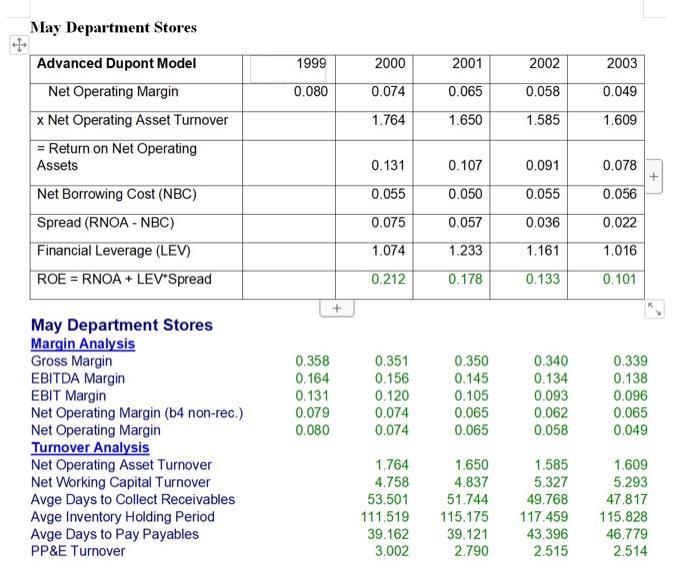
Ross Stores Advanced Dupont Model 1999 2000 2001 2002 2003 Net Operating Margin 0.061 0.057 0.053 0.057 0.058 Net Operating Asset Turnover 5.391 5.551 5.824 5.321 Return on Net Operating Assets 0.306 0.292 0.332 0.310 + Net Borrowing Cost (NBC) 0.066 0.060 0.014 0.000 Spread (RNOA - NBC) 0.240 0.231 0.318 0.310 Financial Leverage (LEV) 0.068 0.063 0.021 0.054 ROE RNOA+LEV Spread 0.323 0.306 0.339 0.326 + Ross Stores Margin Analysis Gross Margin 0.314 0.312 0.311 0.274 0.275 EBITDA Margin 0.123 0.114 0.107 0.112 0.115 EBIT Margin 0.103 0.093 0.086 0.094 0.095 Net Operating Margin (b4 non-rec.) 0.063 0.057 0.053 0.057 0.058 Net Operating Margin 0.061 0.057 0.053 0.057 0.058 Turnover Analysis Net Operating Asset Turnover 5.391 5.551 5.824 5.321 Net Working Capital Turnover 12.847 13.087 13.552 11.131 Avge Days to Collect Receivables Avge Inventory Holding Period Avge Days to Pay Payables PP&E Turnover 2.028 2.136 2.010 2.031 103.866 104.916 95.437 100.076 52.056 52.599 52.606 56.791 9.426 9.433 9.619 8.841 6. Tables below contain information about OSTK, AMZN, ROST, and MAY. Complete the table for Overstock.com for 2003 on page 6. (4 points) And discuss the key strengths and weaknesses of OSTK's financial performance compared to its competitors (the data related to competitors is presented on page 7, 8 and 9). (4 points) Amazon.com Advanced Dupont Model Net Operating Margin x Net Operating Asset Turnover = Return on Net Operating Assets Net Borrowing Cost (NBC) Spread (RNOA - NBC) Financial Leverage (LEV) ROE RNOA+LEV*Spread Amazon.com Margin Analysis 1999 2000 2001 2002 2003 (0.387) (0.464) (0.137) (0.002) 0.031 1.889 3.273 4.713 5.686 (0.876) (0.449) (0.007) 0.179 0.072 0.065 0.064 0.061 (0.948) (0.513) (0.072) 0.117 (5.171) (1.793) (1.598) (1.775) 4.027 0.471 0.107 (0.030) + Gross Margin 0.218 0.238 0.239 0.273 0.253 EBITDA Margin (0.192) (0.123) (0.032) 0.049 0.066 EBIT Margin (0.364) (0.240) (0.074) 0.027 0.051 Net Operating Margin (b4 non-rec.) (0.364) (0.240) (0.074) 0.027 0.051 Net Operating Margin (0.387) (0.464) (0.137) (0.002) 0.031 Turnover Analysis Net Operating Asset Turnover 1.889 3.273 4.713 5.686 Net Working Capital Turnover 8.002 8.867 9.098 9.272 Avge Days to Collect Receivables Avge Inventory Holding Period Avge Days to Pay Payables PP&E Turnover 0.000 0.000 5.210 8.472 34.261 24.458 22.103 23.043 80.458 70.558 69.293 68.349 8.076 9.786 15.389 22.704 May Department Stores Advanced Dupont Model 1999 2000 2001 2002 2003 Net Operating Margin 0.080 0.074 0.065 0.058 0.049 x Net Operating Asset Turnover 1.764 1.650 1.585 1.609 = Return on Net Operating Assets 0.131 0.107 0.091 0.078 + Net Borrowing Cost (NBC) 0.055 0.050 0.055 0.056 Spread (RNOA- NBC) 0.075 0.057 0.036 0.022 Financial Leverage (LEV) 1.074 1.233 1.161 1.016 ROE =RNOA + LEV*Spread 0.212 0.178 0.133 0.101 + May Department Stores Margin Analysis Gross Margin 0.358 0.351 0.350 0.340 0.339 EBITDA Margin 0.164 0.156 0.145 0.134 0.138 EBIT Margin 0.131 0.120 0.105 0.093 0.096 Net Operating Margin (b4 non-rec.) 0.079 0.074 0.065 0.062 0.065 Net Operating Margin 0.080 0.074 0.065 0.058 0.049 Turnover Analysis Net Operating Asset Turnover 1.764 1.650 1.585 1.609 Net Working Capital Turnover 4.758 4.837 5.327 5.293 Avge Days to Collect Receivables Avge Inventory Holding Period Avge Days to Pay Payables PP&E Turnover 53.501 51.744 49.768 47.817 111.519 115.175 117.459 115.828 39.162 39.121 43.396 46.779 3.002 2.790 2.515 2.514
Step by Step Solution
★★★★★
3.41 Rating (148 Votes )
There are 3 Steps involved in it
Step: 1
Overstockcom Advanced Dupont Model 2003 Net Operating Margin 0031 x Net Operating Asset Turnover 673...
Get Instant Access to Expert-Tailored Solutions
See step-by-step solutions with expert insights and AI powered tools for academic success
Step: 2

Step: 3

Ace Your Homework with AI
Get the answers you need in no time with our AI-driven, step-by-step assistance
Get Started


