Answered step by step
Verified Expert Solution
Question
1 Approved Answer
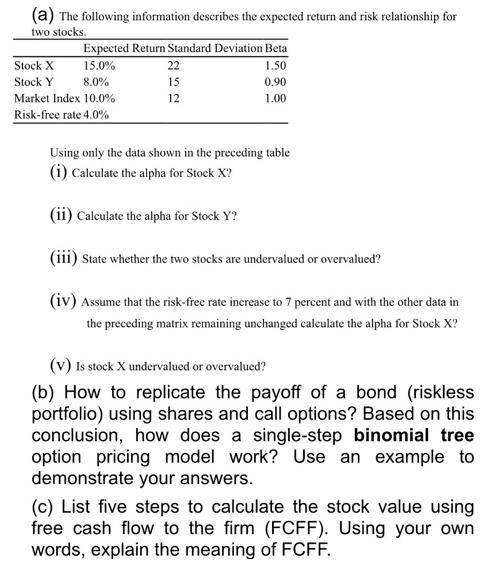
(a) The following information describes the expected return and risk relationship for two stocks. Expected Return Standard Deviation Beta 1.50 0.90 1.00 Stock X

(a) The following information describes the expected return and risk relationship for two stocks. Expected Return Standard Deviation Beta 1.50 0.90 1.00 Stock X 15.0% Stock Y 8.0% Market Index 10.0% Risk-free rate 4.0% 22 15 12 Using only the data shown in the preceding table (i) Calculate the alpha for Stock X? (ii) Calculate the alpha for Stock Y? (iii) State whether the two stocks are undervalued or overvalued? (iv) Assume that the risk-free rate increase to 7 percent and with the other data in the preceding matrix remaining unchanged calculate the alpha for Stock X? (V) Is stock X undervalued or overvalued? (b) How to replicate the payoff of a bond (riskless portfolio) using shares and call options? Based on this conclusion, how does a single-step binomial tree option pricing model work? Use an example to demonstrate your answers. (c) List five steps to calculate the stock value using free cash flow to the firm (FCFF). Using your own words, explain the meaning of FCFF.
Step by Step Solution
★★★★★
3.46 Rating (159 Votes )
There are 3 Steps involved in it
Step: 1
a i Alpha for Stock X 15 150 10 4 65 ii Alpha for Stock Y 8 090 10 4 12 iii Stock X is undervalued a...
Get Instant Access to Expert-Tailored Solutions
See step-by-step solutions with expert insights and AI powered tools for academic success
Step: 2

Step: 3

Ace Your Homework with AI
Get the answers you need in no time with our AI-driven, step-by-step assistance
Get Started


