Currently, about 190,000 cubic meters of material are shipped annually from China and Taiwan. This is expected Per 452 to grow about I5 percent

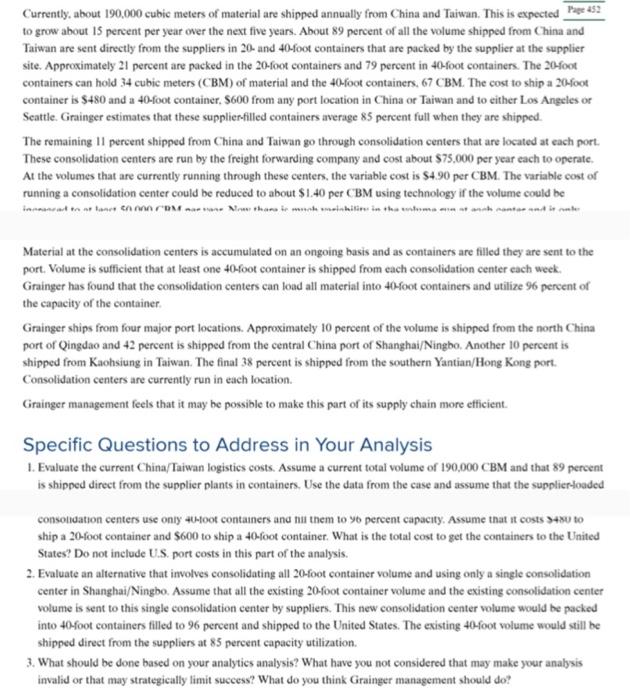
Currently, about 190,000 cubic meters of material are shipped annually from China and Taiwan. This is expected Per 452 to grow about I5 percent per year over the next five years. About 89 percent of all the volume shipped from China and Taiwan are sent directly from the suppliers in 20- and 40-foot containers that are packed by the supplier at the supplier site. Approximately 21 percent are packed in the 20-foot containers and 79 percent in 40-foot containers. The 20foot containers can hold 34 cubic meters (CBM) of material and the 40-foot containers, 67 CBM. The cost to ship a 20-foot container is $480 and a 40-foot container, $600 from any port location in China or Taiwan and t either Los Angeles or Seattle. Grainger estimates that these supplier-filled containers average 85 percent full when they are shipped. The remaining 11 percent shipped from China and Taiwan go through consolidation centers that are located at each port. These consolidation centers are run by the freight forwarding company and cost about $75,000 per year each to operate. At the volumes that are currently running through these centers, the variable cost is $4.90 per CBM. The variable cost of running a consolidation center could be reduced to about $1.40 per CBM using technology if the volume could be innnansat ta at tanes en nnn rDM nar an No thana ie mnak mainkilie in tha tntoma ena at aah nantar and in nter Material at the consolidation centers is accumulated on an ongoing basis and as containers are filed they are sent to the port. Volume is sufficient that at least one 40foot container is shipped from each consolidation center each week. Grainger has found that the consolidation centers can load all material into 40-foot containers and utilize 96 percent of the capacity of the container. Grainger ships from four major port locations. Approximately 10 percent of the volume is shipped from the north China port of Qingdao and 42 percent is shipped from the central China port of Shanghai/Ningbo. Another 10 percent is shipped from Kaohsiung in Taiwan. The final 38 percent is shipped from the southern Yantian/Hong Kong port. Consolidation centers are currently run in each location. Grainger management fees that it may be possible to make this part of its supply chain more efficient. Specific Questions to Address in Your Analysis 1. Evaluate the current China/Taiwan logisties costs. Assume a current total volume of 190,000 CBM and that 89 percent is shipped direct from the supplier plants in containers. Use the data from the case and assume that the supplier-loaded consotidation centers use onty 40-loot containers and nii them to y6 percent capacity. Assume that it costs 480 to ship a 20-foot container and $600 to ship a 40-foot container. What is the total cost to get the containers to the United States? Do not include U.S. port costs in this part of the analysis. 2. Evaluate an alternative that involves consolidating all 20-foot container volume and using only a single consolidation center in Shanghai/Ningbo. Assume that all the existing 20-foot container volume and the existing consolidation center volume is sent to this single consolidation center by suppliers. This new consolidation center volume would be packed into 40foot containers filled to 96 percent and shipped to the United States. The existing 40-foot volume would still be shipped direct from the suppliers at 85 percent capacity utilization. 3. What should be done based on your analytics analysis? What have you not considered that may make your analysis invalid or that may strategically limit success? What do you think Grainger management should do?
Step by Step Solution
3.41 Rating (148 Votes )
There are 3 Steps involved in it
Step: 1
Part A Part B Consider the accompanying data concerning Company WWG Figure the delivery cost of the organization as demonstrated underneath Consequent...
See step-by-step solutions with expert insights and AI powered tools for academic success
Step: 2

Step: 3

Ace Your Homework with AI
Get the answers you need in no time with our AI-driven, step-by-step assistance
Get Started


