Answered step by step
Verified Expert Solution
Question
1 Approved Answer
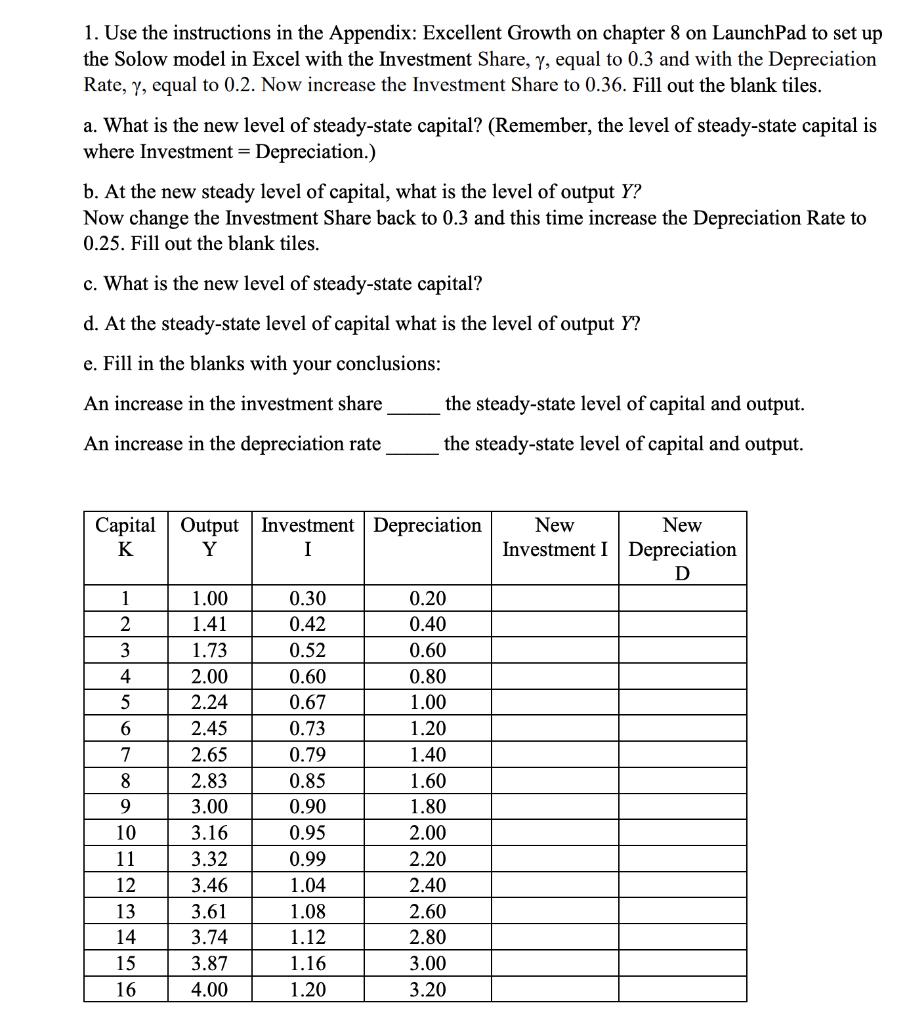
1. Use the instructions in the Appendix: Excellent Growth on chapter 8 on LaunchPad to set up the Solow model in Excel with the


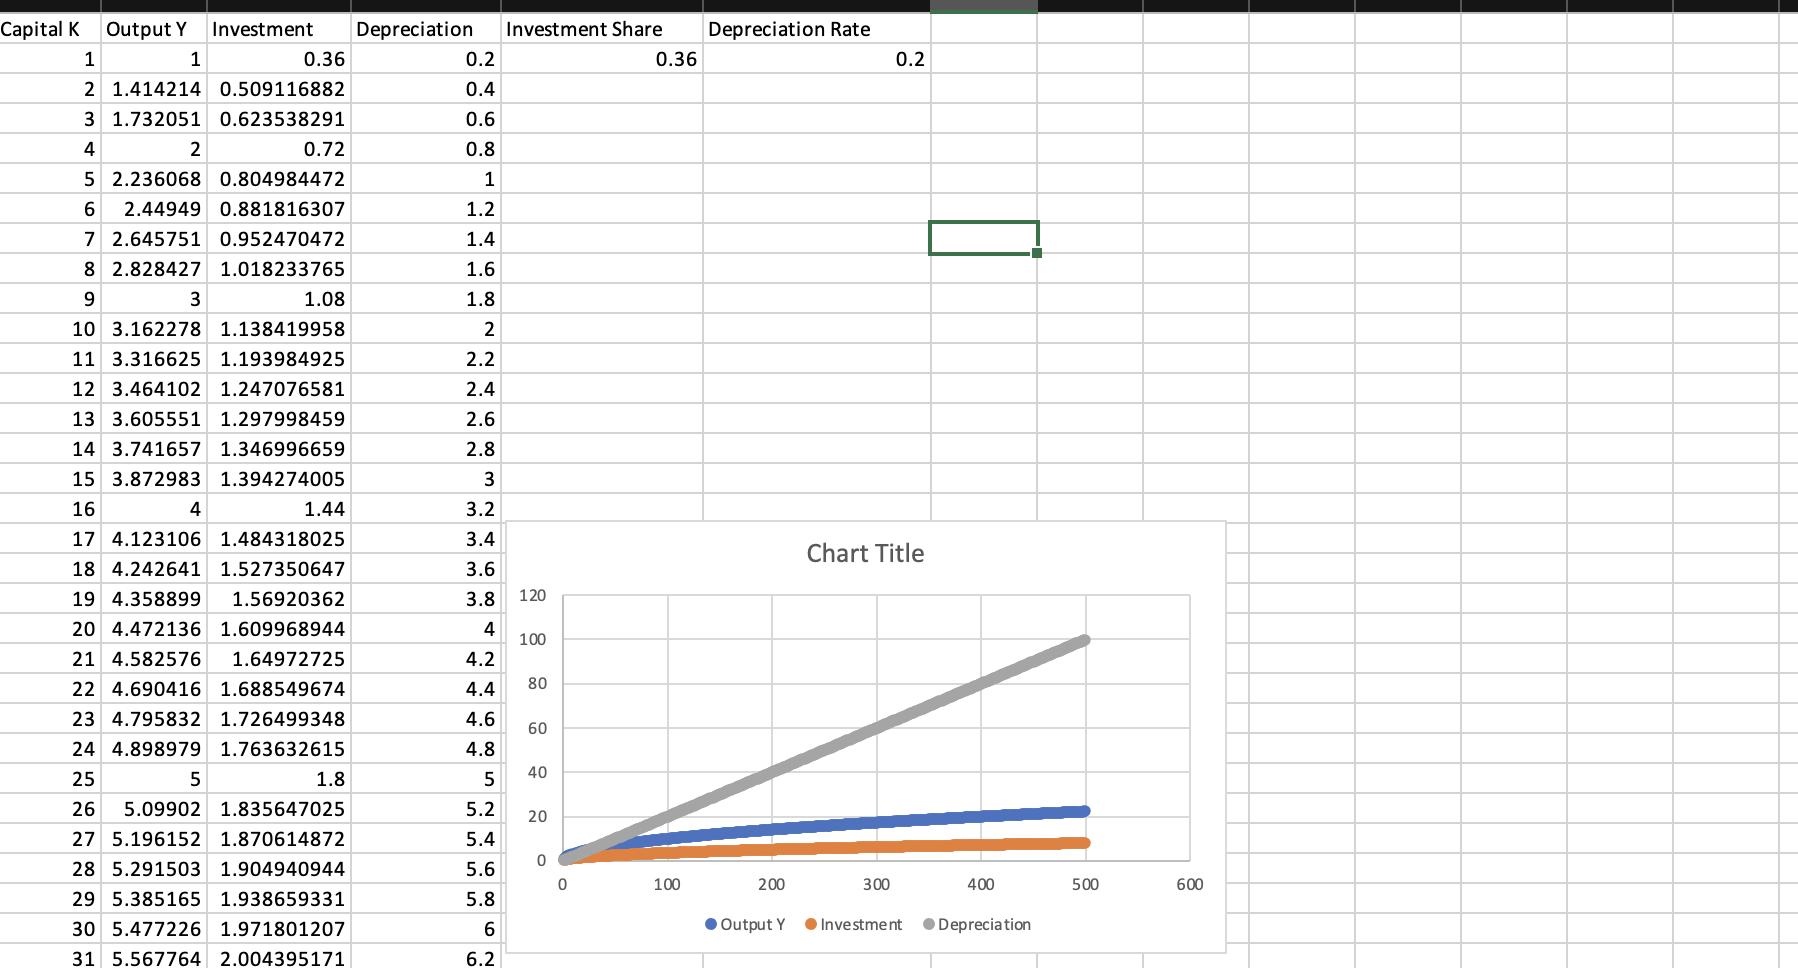
1. Use the instructions in the Appendix: Excellent Growth on chapter 8 on LaunchPad to set up the Solow model in Excel with the Investment Share, y, equal to 0.3 and with the Depreciation Rate, y, equal to 0.2. Now increase the Investment Share to 0.36. Fill out the blank tiles. a. What is the new level of steady-state capital? (Remember, the level of steady-state capital is where Investment = Depreciation.) b. At the new steady level of capital, what is the level of output Y? Now change the Investment Share back to 0.3 and this time increase the Depreciation Rate to 0.25. Fill out the blank tiles. c. What is the new level of steady-state capital? d. At the steady-state level of capital what is the level of output Y? e. Fill in the blanks with your conclusions: An increase in the investment share An increase in the depreciation rate Capital Output Investment K Y I 1 2 3 4 5 6 7 8 9 PHLBH56 10 11 12 13 14 15 16 1.00 1.41 1.73 2.00 2.24 2.45 2.65 2.83 3.00 3.16 3.32 3.46 3.61 3.74 3.87 4.00 0.30 0.42 0.52 0.60 0.67 0.73 0.79 0.85 0.90 0.95 0.99 1.04 1.08 1.12 1.16 1.20 the steady-state level of capital and output. the steady-state level of capital and output. Depreciation 0.20 0.40 0.60 0.80 1.00 1.20 1.40 1.60 1.80 2.00 2.20 2.40 2.60 2.80 3.00 3.20 New New Investment I Depreciation D Capital K Output Y Investment Depreciation Investment Share Depreciation Rate 1 0.36 1 2 1.414214 0.509116882 3 1.732051 0.623538291 4 2 3 0.36 5 2.236068 0.804984472 6 2.44949 0.881816307 7 2.645751 0.952470472 8 2.828427 1.018233765 9 10 3.162278 1.138419958 11 3.316625 1.193984925 12 3.464102 1.247076581 13 3.605551 1.297998459 14 3.741657 1.346996659 15 3.872983 1.394274005 16 17 4.123106 1.484318025 18 4.242641 1.527350647 19 4.358899 1.56920362 20 4.472136 1.609968944 21 4.582576 1.64972725 22 4.690416 1.688549674 23 4.795832 1.726499348 24 4.898979 1.763632615 25 26 5.09902 1.835647025 27 5.196152 1.870614872 28 5.291503 1.904940944 29 5.385165 1.938659331 30 5.477226 1.971801207 31 5.567764 2.004395171 4 5 0.72 1.08 1.44 1.8 0.2 0.4 0.6 0.8 1 1.2 1.4 1.6 1.8 2 2.2 2.4 2.6 2.8 3 3.2 3.4 3.6 3.8 4 4.2 4.4 4.6 4.8 5 5.2 5.4 5.6 5.8 6 6.2 120 100 80 60 40 20 0 0 100 200 0.2 Chart Title 300 400 Output Y Investment Depreciation 500 600
Step by Step Solution
★★★★★
3.44 Rating (154 Votes )
There are 3 Steps involved in it
Step: 1
1100 2 147 3 173 4 1200 5224 6245 7 265 8283 300 3016 9 To 11 12 332 361 374 13 14 15 ...
Get Instant Access to Expert-Tailored Solutions
See step-by-step solutions with expert insights and AI powered tools for academic success
Step: 2

Step: 3

Ace Your Homework with AI
Get the answers you need in no time with our AI-driven, step-by-step assistance
Get Started


