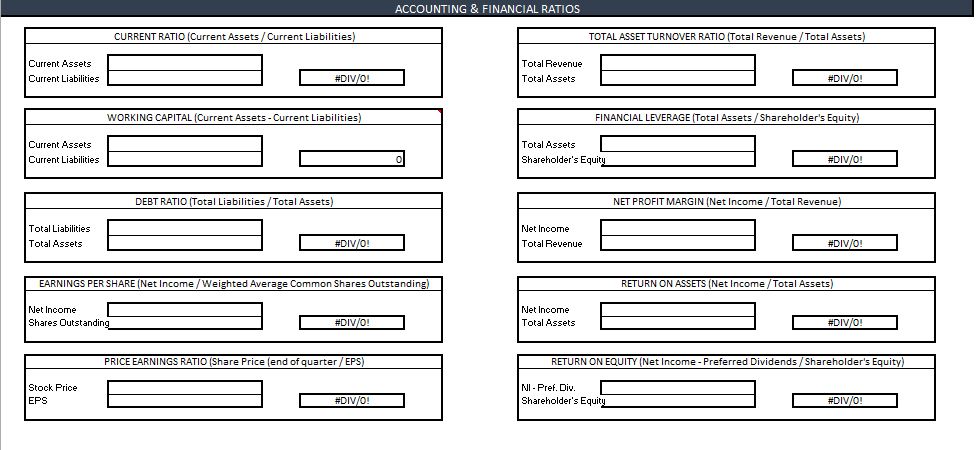
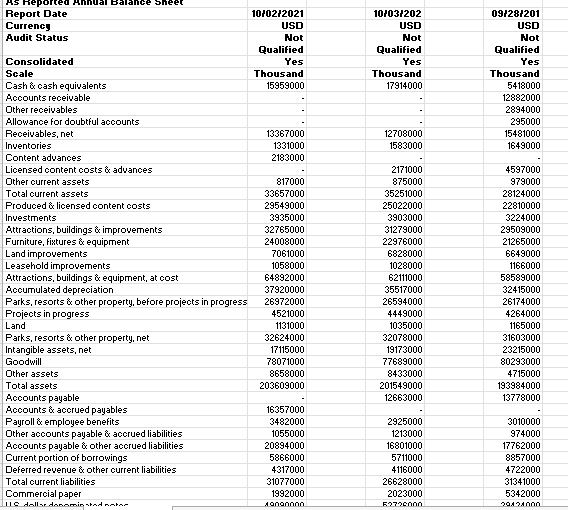
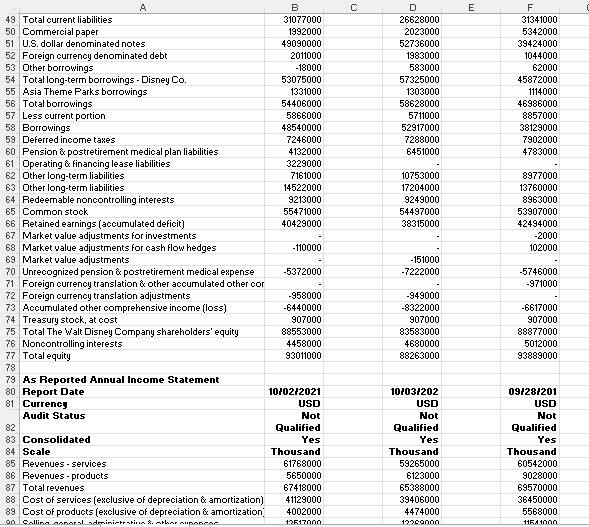
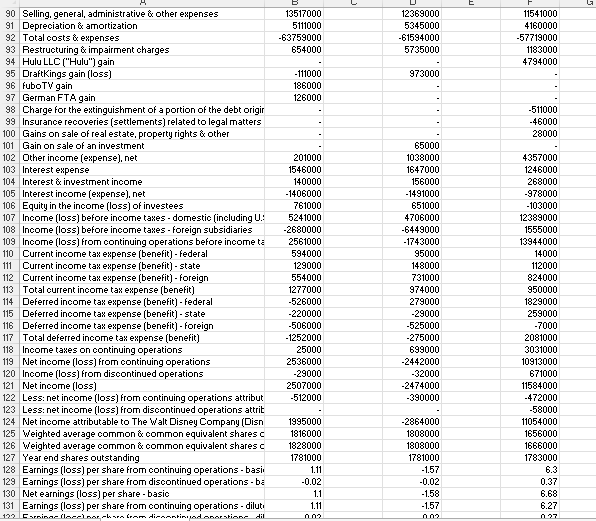
ACCOUNTING & FINANCIAL RATIOS CURRENT RATIO (Current Assets / Current Liabilities) TOTAL ASSET TURNOVER RATIO (Total Revenue / Total Assets) Current Assets Current Liabilities Total Revenue Total Assets #DIV/0! #DIV/0! WORKING CAPITAL (Current Assets - Current Liabilities) FINANCIAL LEVERAGE (Total Assets / Shareholder's Equity) Current Assets Current Liabilities Total Assets Shareholder's Equity #DIV/0! DEBT RATIO (Total Liabilities/Total Assets) NET PROFIT MARGIN (Net Income / Total Revenue) Total Liabilities Total Assets Net Income Total Revenue #DIV/0! #DIV/0! EARNINGS PER SHARE (Net Income /Weighted Average Common Shares Outstanding RETURN ON ASSETS (Net Income/Total Assets) Net Income Shares Outstanding Net Income Total Assets #DIV/0! #DIV/0! PRICE EARNINGS RATIO (Share Price (end of quarter /EPS) RETURN ON EQUITY (Net Income - Preferred Dividends / Shareholder's Equity) Stock Price EPS NI - Pref. Div. Shareholder's Equity #DIV/O #DIV/0! 10/03/202 USD Not Qualified Yes Thousand 17914000 09/28/201 USD Not Qualified Yes Thousand 5418000 12882000 2894000 295000 15481000 1649000 12708000 1583000 AS Reported al Balance Sheet Report Date 10/02/2021 Currency USD Audit Status Not Qualified Consolidated Yes Scale Thousand Cash & oash equivalents 15959000 Accounts receivable Other receivables Allowance for doubtful accounts Receivables, net 13367000 Inventories 1331000 Content advances 2183000 Licensed content costs & advances Other current assets 817000 Total ourrent assets 33657000 Produced & licensed content costs 29549000 Investments 3935000 Attractions, buildings & improvements 32765000 Furniture, fixtures & equipment 24008000 Land improvements 7061000 Leasehold improvements 1058000 Attractions, buildings & equipment, at cost 64892000 Accumulated depreciation 37920000 Parks, resorts & other property, before projects in progress 26972000 Projects in progress 4521000 Land 1131000 Parks, resorts & other property, net 32624000 Intangible assets, net 17115000 Goodwill 78071000 Other assets 8658000 Total assets 203609000 Accounts payable Accounts & accrued payables 16357000 Payroll & employee benefits 3482000 Other accounts payable & accrued liabilities 1055000 Accounts payable & other accrued liabilities 20894000 Current portion of borrowings 5866000 Deferred revenue & other current liabilities 4317000 Total current liabilities 31077000 Commercial paper 1992000 ile dolls denominada 0000000 2171000 875000 35251000 25022000 3903000 31279000 22976000 6828000 1028000 62111000 35517000 26594000 4449000 1035000 32078000 19173000 77689000 8433000 201549000 12663000 4597000 979000 28124000 22810000 3224000 29509000 21265000 6649000 1166000 58589000 32415000 26174000 4264000 1165000 31603000 23215000 80293000 4715000 193984000 13778000 2925000 1213000 16801000 5711000 4116000 26628000 2023000 52720000 3010000 974000 17762000 8857000 4722000 31341000 5342000 20121000 C E B 31077000 1992000 49090000 2011000 - 18000 53075000 1331000 54406000 5866000 48540000 7246000 4132000 3229000 7161000 14522000 9213000 55471000 40429000 D 26628000 2023000 52736000 1983000 583000 57325000 1303000 58628000 5711000 52917000 7288000 6451000 F 31341000 5342000 39424000 1044000 62000 45872000 1114000 46986000 8857000 38129000 7902000 4783000 10753000 17204000 9249000 54497000 38315000 8977000 13760000 8963000 53907000 42494000 -2000 102000 - 110000 A 49 Total current liabilities 50 Commercial paper 51 U.S. dollar denominated notes 52 Foreign currency denominated debt 53 Other borrowings 54 Total long-term borrowings - Disney Co. 55 Asia Theme Parks borrowings 56 Total borrowings 57 Less Ourrent portion 58 Borrowings 59 Deferred income taxes 60 Pension & postretirement medical plan liabilities 61 Operating & Financing lease liabilities 62 Other long-term liabilities 63 Other long-term liabilities 64 Redeemable noncontrolling interests 65 Common stook 66 Retained earnings (accumulated deficit) 67 Market value adjustments for investments 68 Market value adjustments for cash flow hedges 69 Market value adjustments 70 Unrecognized pension & postretirement medical expense 71 Foreign currency translation & other accumulated other cor 72 Foreign currency translation adjustments 73 Accumulated other comprehensive income (loss) 74 Treasury stock, at cost 75 Total The Walt Disney Company shareholders' equity 76 Noncontrolling interests 77 Total equity 78 79 As Reported Annual Income Statement 80 Report Date 81 Currency Audit Status 82 83 Consolidated 84 Scale 85 Revenues - services 86 Revenues .products 87 Total revenues 88 Cost of services (exclusive of depreciation & amortization) 89 Cost of products (exclusive of depreciation & amortization Callina 5Amlrl=trati*. --- -151000 -7222000 -5372000 -5746000 -971000 -958000 -6440000 907000 88553000 4458000 93011000 -949000 -8322000 907000 83583000 4680000 88263000 -6617000 907000 88877000 5012000 93889000 10/02/2021 USD Not Qualified Yes Thousand 61768000 5650000 67418000 41129000 4002000 12617000 10/03/202 USD Not Qualified Yes Thousand 59265000 6123000 65388000 39406000 4474000 12200000 09/28/201 USD Not Qualified Yes Thousand 60542000 9028000 69570000 36450000 5568000 116.1000 E 13517000 5111000 -63759000 654000 12369000 5345000 -61594000 5735000 11541000 4160000 -57719000 1183000 4794000 973000 - 111000 186000 126000 -511000 -46000 28000 90 Selling general, administrative & other expenses 91 Depreciation & amortization 92 Total costs & expenses 93 Restructuring & impairment charges 94 Hulu LLC ("Hulu") gain 95 DraftKings gain (loss) 96 fubo TV gain 97 German FTA gain 98 Charge for the extinguishment of a portion of the debt origir 99 Insurance recoveries (settlements) related to legal matters 100 Gains on sale of real estate property rights & other 101 Gain on sale of an investment 102 Other income (expense), net 103 Interest expense 104 Interest & investment income 105 Interest income (expense), net 106 Equity in the income (loss) of investees 107 Income (loss) before income taxes - domestic (including U.! 108 Income (loss) before income taxes - foreign subsidiaries 109 Income (loss) from continuing operations before income ta 110 Current income tax expense (benefit) - Federal 111 Current income tax expense (benefit) - state 112 Current income tax expense (benefit) - foreign 113 Total current income tax expense (benefit) 114 Deferred income tax expense (benefit) - federal 115 Deferred income tax expense (benefit) - state 116 Deferred income tax expense (benefit) - foreign 117 Total deferred income tax expense (benefit) 118 Income taxes on continuing operations 119 Net income (loss) from continuing operations 120 Income (loss) from discontinued operations 121 Net income (loss) 122 Less: net income (loss) from continuing operations attribut 123 Less: net income (loss) from discontinued operations attrit 124 Net income attributable to The Walt Disney Company (Disn 125 Weighted average common & common equivalent sharesc 126 Weighted average common & common equivalent sharesc 127 Year end shares outstanding 128 Earnings (loss) per share from continuing operations - basi 129 Earnings (loss) per share from discontinued operations - ba 130 Net earnings (loss) per share-basic 131 Earnings (loss) per share from continuing operations - dilut 129 Crnicaellacelor care cram di santinsdonorstione dil 201000 1546000 140000 -1406000 761000 5241000 -2680000 2561000 594000 129000 554000 1277000 -526000 -220000 -506000 -1252000 25000 2536000 -29000 2507000 -512000 65000 1038000 1647000 156000 -1491000 651000 4706000 -6449000 -1743000 95000 148000 731000 974000 279000 -29000 -525000 -275000 699000 -2442000 -32000 -2474000 -390000 4357000 1246000 268000 -978000 -103000 12389000 1555000 13944000 14000 112000 824000 950000 1829000 259000 -7000 2081000 3031000 10913000 671000 11584000 -472000 -58000 11054000 1656000 1666000 1783000 6.3 0.37 6.68 6.27 027 1995000 1816000 1828000 1781000 1.11 -0.02 1.1 1.11 -2864000 1808000 1808000 1781000 -1.57 -0.02 -1.58 -1.57 109 -0.02 -1.58 0.88 203000 826250 115000 0.37 6.64 1.76 223000 850000 -396000 142 10/03/202 USD Not Qualified Yes Thousand 42494000 1596000 09/28/201 USD Not Qualified Yes Thousand 82679000 2913000 691000 192000 - 116000 22000 197000 132 Earnings (loss) per share from discontinued operations - dil -0.02 133 Net earnings (loss) per share. diluted 134 Dividends per share 135 Total number of employees 190000 136 Number of common stockholders 813000 137 Foreign currency translation adjustments 138 139 As Reported Annual Retained Earnings 440 Report Date 10/02/2021 141 Currency USD Audit Status Not Qualified 143 Consolidated Yes 144 Scale Thousand 145 Previous retained earnings (accumulated deficit) 38315000 146 Dividends 147 Adoption of new accounting guidance - reclassification of a 148 Adoption of new accounting guidance - intra-entity transfers 149 Adoption of new accounting guidance - revenues from con! 150 Adoption of new accounting guidance - other 151 Adoption of new lease accounting guidance 152 Retirement of treasury stook 153 Distributions & other retained earnings 10000 154 Cumulative effect of accounting changes 109000 155 Retained earnings (accumulated deficit) 40429000 156 157 As Reported Annual Cash Flow 158 Report Date 10/02/2021 159 Currency USD Audit Status Not 160 Qualified 161 Consolidated Yes 162 Scale Thousand 163 Net income (loss) from continuing operations 2536000 164 Depreciation & amortization 5111000 165 Goodwill & intangible asset impairment 166 Gain on acquisitions & dispositions 167 Net loss (gain) on investments, acquisitions & dispositions -332000 168 Deferred income taxes -1241000 169 Equity in the loss (income) of investees -761000 170 Cash distributions received from equity investees 754000 171 Net change in produced & licensed content costs & advanc -4301000 49118000 3000 84000 38315000 42494000 10/03/202 USD Not Qualified Yes Thousand -2442000 5345000 4953000 09/28/201 USD Not Qualified Yes Thousand 10913000 4160000 -4794000 -920000 -392000 -651000 774000 397000 117000 103000 754000 -542000 110 100 ndh. -332000 -1241000 -761000 754000 -4301000 46000 600000 816000 144000 -357000 252000 171000 -920000 -392000 -651000 774000 397000 31000 525000 117000 103000 754000 -542000 711000 641000 1943000 14000 -157000 206000 55000 -223000 932000 191000 -2293000 -152000 -6599000 2410000 -282000 5566000 5566000 -3578000 7616000 -4022000 5984000 -4876000 -9901000 -319000 172000 167 Net loss (gain) on investments, acquisitions & dispositions 168 Deferred income taxes 169 Equity in the loss (income) of investees 170 Cash distributions received from equity investees 171 Net change in produced & licensed content costs & advanc 172 Net change in operating lease right of use assetsd liabilities 173 Equity-based compensation 174 Pension & postretirement medical amortization 175 Other adjustments 176 Receivables 177 Inventories 178 Other assets 179 Accounts payable & other accrued liabilities 180 Accounts payable & other liabilities 181 Income taxes 182 Net cash flows from operating activities - continuing operat 183 Net cash flows from operating activities 184 Investments in parks, resorts & other property 185 Acquisitions 186 Other investing activities 187 Net cash flows from investing activities - continuing operati 188 Net cash flows from investing activities 189 Commercial paper borrowings (payments), net 190 Borrowings 191 Reduction of borrowings 192 Dividends 193 Proceeds from exercise of stock options 194 Contributions from or sales of noncontrolling interests 195 Acquisitions of noncontrolling & redeemable noncontrolling 196 Other financing activities 197 Net cash flows from financing actvities - continuing operatii 198 Net cash flows from financing actvities 199 Cash flows from operating activities of discontinued operal 200 Cash flows from investing activities of discontinued operat 201 Cash flows from financing activities of discontinued operat 202 Cash from (used in) discontinued operations 203 Impact of exchange rates on cash, cash equivalents & restri 204 Change in cash, cash equivalents & restricted cash 205 Cash, cash equivalents & restricted cash, beginning of year 206 Cash, cash equivalents & restricted cash, end of year 207 Interest paid 208 Income taxes paid 407000 -3171000 -3171000 -26000 64000 -3737000 -3850000 -3354000 18120000 -3533000 -1587000 305000 94000 -15096000 4318000 38240000 -38881000 -2895000 318000 737000 -1430000 -871000 -1565000 435000 91000 -350000 -862000 -4385000 -4385000 1000 8000 8480000 2000 213000 9000 30000 -1951000 17954000 16003000 1892000 1638000 215000 38000 12499000 5455000 17954000 1559000 738000 -464000 622000 10978000 -626000 10974000 -98000 1300000 4155000 5455000 1142000 9259000 200 ACCOUNTING & FINANCIAL RATIOS CURRENT RATIO (Current Assets / Current Liabilities) TOTAL ASSET TURNOVER RATIO (Total Revenue / Total Assets) Current Assets Current Liabilities Total Revenue Total Assets #DIV/0! #DIV/0! WORKING CAPITAL (Current Assets - Current Liabilities) FINANCIAL LEVERAGE (Total Assets / Shareholder's Equity) Current Assets Current Liabilities Total Assets Shareholder's Equity #DIV/0! DEBT RATIO (Total Liabilities/Total Assets) NET PROFIT MARGIN (Net Income / Total Revenue) Total Liabilities Total Assets Net Income Total Revenue #DIV/0! #DIV/0! EARNINGS PER SHARE (Net Income /Weighted Average Common Shares Outstanding RETURN ON ASSETS (Net Income/Total Assets) Net Income Shares Outstanding Net Income Total Assets #DIV/0! #DIV/0! PRICE EARNINGS RATIO (Share Price (end of quarter /EPS) RETURN ON EQUITY (Net Income - Preferred Dividends / Shareholder's Equity) Stock Price EPS NI - Pref. Div. Shareholder's Equity #DIV/O #DIV/0! 10/03/202 USD Not Qualified Yes Thousand 17914000 09/28/201 USD Not Qualified Yes Thousand 5418000 12882000 2894000 295000 15481000 1649000 12708000 1583000 AS Reported al Balance Sheet Report Date 10/02/2021 Currency USD Audit Status Not Qualified Consolidated Yes Scale Thousand Cash & oash equivalents 15959000 Accounts receivable Other receivables Allowance for doubtful accounts Receivables, net 13367000 Inventories 1331000 Content advances 2183000 Licensed content costs & advances Other current assets 817000 Total ourrent assets 33657000 Produced & licensed content costs 29549000 Investments 3935000 Attractions, buildings & improvements 32765000 Furniture, fixtures & equipment 24008000 Land improvements 7061000 Leasehold improvements 1058000 Attractions, buildings & equipment, at cost 64892000 Accumulated depreciation 37920000 Parks, resorts & other property, before projects in progress 26972000 Projects in progress 4521000 Land 1131000 Parks, resorts & other property, net 32624000 Intangible assets, net 17115000 Goodwill 78071000 Other assets 8658000 Total assets 203609000 Accounts payable Accounts & accrued payables 16357000 Payroll & employee benefits 3482000 Other accounts payable & accrued liabilities 1055000 Accounts payable & other accrued liabilities 20894000 Current portion of borrowings 5866000 Deferred revenue & other current liabilities 4317000 Total current liabilities 31077000 Commercial paper 1992000 ile dolls denominada 0000000 2171000 875000 35251000 25022000 3903000 31279000 22976000 6828000 1028000 62111000 35517000 26594000 4449000 1035000 32078000 19173000 77689000 8433000 201549000 12663000 4597000 979000 28124000 22810000 3224000 29509000 21265000 6649000 1166000 58589000 32415000 26174000 4264000 1165000 31603000 23215000 80293000 4715000 193984000 13778000 2925000 1213000 16801000 5711000 4116000 26628000 2023000 52720000 3010000 974000 17762000 8857000 4722000 31341000 5342000 20121000 C E B 31077000 1992000 49090000 2011000 - 18000 53075000 1331000 54406000 5866000 48540000 7246000 4132000 3229000 7161000 14522000 9213000 55471000 40429000 D 26628000 2023000 52736000 1983000 583000 57325000 1303000 58628000 5711000 52917000 7288000 6451000 F 31341000 5342000 39424000 1044000 62000 45872000 1114000 46986000 8857000 38129000 7902000 4783000 10753000 17204000 9249000 54497000 38315000 8977000 13760000 8963000 53907000 42494000 -2000 102000 - 110000 A 49 Total current liabilities 50 Commercial paper 51 U.S. dollar denominated notes 52 Foreign currency denominated debt 53 Other borrowings 54 Total long-term borrowings - Disney Co. 55 Asia Theme Parks borrowings 56 Total borrowings 57 Less Ourrent portion 58 Borrowings 59 Deferred income taxes 60 Pension & postretirement medical plan liabilities 61 Operating & Financing lease liabilities 62 Other long-term liabilities 63 Other long-term liabilities 64 Redeemable noncontrolling interests 65 Common stook 66 Retained earnings (accumulated deficit) 67 Market value adjustments for investments 68 Market value adjustments for cash flow hedges 69 Market value adjustments 70 Unrecognized pension & postretirement medical expense 71 Foreign currency translation & other accumulated other cor 72 Foreign currency translation adjustments 73 Accumulated other comprehensive income (loss) 74 Treasury stock, at cost 75 Total The Walt Disney Company shareholders' equity 76 Noncontrolling interests 77 Total equity 78 79 As Reported Annual Income Statement 80 Report Date 81 Currency Audit Status 82 83 Consolidated 84 Scale 85 Revenues - services 86 Revenues .products 87 Total revenues 88 Cost of services (exclusive of depreciation & amortization) 89 Cost of products (exclusive of depreciation & amortization Callina 5Amlrl=trati*. --- -151000 -7222000 -5372000 -5746000 -971000 -958000 -6440000 907000 88553000 4458000 93011000 -949000 -8322000 907000 83583000 4680000 88263000 -6617000 907000 88877000 5012000 93889000 10/02/2021 USD Not Qualified Yes Thousand 61768000 5650000 67418000 41129000 4002000 12617000 10/03/202 USD Not Qualified Yes Thousand 59265000 6123000 65388000 39406000 4474000 12200000 09/28/201 USD Not Qualified Yes Thousand 60542000 9028000 69570000 36450000 5568000 116.1000 E 13517000 5111000 -63759000 654000 12369000 5345000 -61594000 5735000 11541000 4160000 -57719000 1183000 4794000 973000 - 111000 186000 126000 -511000 -46000 28000 90 Selling general, administrative & other expenses 91 Depreciation & amortization 92 Total costs & expenses 93 Restructuring & impairment charges 94 Hulu LLC ("Hulu") gain 95 DraftKings gain (loss) 96 fubo TV gain 97 German FTA gain 98 Charge for the extinguishment of a portion of the debt origir 99 Insurance recoveries (settlements) related to legal matters 100 Gains on sale of real estate property rights & other 101 Gain on sale of an investment 102 Other income (expense), net 103 Interest expense 104 Interest & investment income 105 Interest income (expense), net 106 Equity in the income (loss) of investees 107 Income (loss) before income taxes - domestic (including U.! 108 Income (loss) before income taxes - foreign subsidiaries 109 Income (loss) from continuing operations before income ta 110 Current income tax expense (benefit) - Federal 111 Current income tax expense (benefit) - state 112 Current income tax expense (benefit) - foreign 113 Total current income tax expense (benefit) 114 Deferred income tax expense (benefit) - federal 115 Deferred income tax expense (benefit) - state 116 Deferred income tax expense (benefit) - foreign 117 Total deferred income tax expense (benefit) 118 Income taxes on continuing operations 119 Net income (loss) from continuing operations 120 Income (loss) from discontinued operations 121 Net income (loss) 122 Less: net income (loss) from continuing operations attribut 123 Less: net income (loss) from discontinued operations attrit 124 Net income attributable to The Walt Disney Company (Disn 125 Weighted average common & common equivalent sharesc 126 Weighted average common & common equivalent sharesc 127 Year end shares outstanding 128 Earnings (loss) per share from continuing operations - basi 129 Earnings (loss) per share from discontinued operations - ba 130 Net earnings (loss) per share-basic 131 Earnings (loss) per share from continuing operations - dilut 129 Crnicaellacelor care cram di santinsdonorstione dil 201000 1546000 140000 -1406000 761000 5241000 -2680000 2561000 594000 129000 554000 1277000 -526000 -220000 -506000 -1252000 25000 2536000 -29000 2507000 -512000 65000 1038000 1647000 156000 -1491000 651000 4706000 -6449000 -1743000 95000 148000 731000 974000 279000 -29000 -525000 -275000 699000 -2442000 -32000 -2474000 -390000 4357000 1246000 268000 -978000 -103000 12389000 1555000 13944000 14000 112000 824000 950000 1829000 259000 -7000 2081000 3031000 10913000 671000 11584000 -472000 -58000 11054000 1656000 1666000 1783000 6.3 0.37 6.68 6.27 027 1995000 1816000 1828000 1781000 1.11 -0.02 1.1 1.11 -2864000 1808000 1808000 1781000 -1.57 -0.02 -1.58 -1.57 109 -0.02 -1.58 0.88 203000 826250 115000 0.37 6.64 1.76 223000 850000 -396000 142 10/03/202 USD Not Qualified Yes Thousand 42494000 1596000 09/28/201 USD Not Qualified Yes Thousand 82679000 2913000 691000 192000 - 116000 22000 197000 132 Earnings (loss) per share from discontinued operations - dil -0.02 133 Net earnings (loss) per share. diluted 134 Dividends per share 135 Total number of employees 190000 136 Number of common stockholders 813000 137 Foreign currency translation adjustments 138 139 As Reported Annual Retained Earnings 440 Report Date 10/02/2021 141 Currency USD Audit Status Not Qualified 143 Consolidated Yes 144 Scale Thousand 145 Previous retained earnings (accumulated deficit) 38315000 146 Dividends 147 Adoption of new accounting guidance - reclassification of a 148 Adoption of new accounting guidance - intra-entity transfers 149 Adoption of new accounting guidance - revenues from con! 150 Adoption of new accounting guidance - other 151 Adoption of new lease accounting guidance 152 Retirement of treasury stook 153 Distributions & other retained earnings 10000 154 Cumulative effect of accounting changes 109000 155 Retained earnings (accumulated deficit) 40429000 156 157 As Reported Annual Cash Flow 158 Report Date 10/02/2021 159 Currency USD Audit Status Not 160 Qualified 161 Consolidated Yes 162 Scale Thousand 163 Net income (loss) from continuing operations 2536000 164 Depreciation & amortization 5111000 165 Goodwill & intangible asset impairment 166 Gain on acquisitions & dispositions 167 Net loss (gain) on investments, acquisitions & dispositions -332000 168 Deferred income taxes -1241000 169 Equity in the loss (income) of investees -761000 170 Cash distributions received from equity investees 754000 171 Net change in produced & licensed content costs & advanc -4301000 49118000 3000 84000 38315000 42494000 10/03/202 USD Not Qualified Yes Thousand -2442000 5345000 4953000 09/28/201 USD Not Qualified Yes Thousand 10913000 4160000 -4794000 -920000 -392000 -651000 774000 397000 117000 103000 754000 -542000 110 100 ndh. -332000 -1241000 -761000 754000 -4301000 46000 600000 816000 144000 -357000 252000 171000 -920000 -392000 -651000 774000 397000 31000 525000 117000 103000 754000 -542000 711000 641000 1943000 14000 -157000 206000 55000 -223000 932000 191000 -2293000 -152000 -6599000 2410000 -282000 5566000 5566000 -3578000 7616000 -4022000 5984000 -4876000 -9901000 -319000 172000 167 Net loss (gain) on investments, acquisitions & dispositions 168 Deferred income taxes 169 Equity in the loss (income) of investees 170 Cash distributions received from equity investees 171 Net change in produced & licensed content costs & advanc 172 Net change in operating lease right of use assetsd liabilities 173 Equity-based compensation 174 Pension & postretirement medical amortization 175 Other adjustments 176 Receivables 177 Inventories 178 Other assets 179 Accounts payable & other accrued liabilities 180 Accounts payable & other liabilities 181 Income taxes 182 Net cash flows from operating activities - continuing operat 183 Net cash flows from operating activities 184 Investments in parks, resorts & other property 185 Acquisitions 186 Other investing activities 187 Net cash flows from investing activities - continuing operati 188 Net cash flows from investing activities 189 Commercial paper borrowings (payments), net 190 Borrowings 191 Reduction of borrowings 192 Dividends 193 Proceeds from exercise of stock options 194 Contributions from or sales of noncontrolling interests 195 Acquisitions of noncontrolling & redeemable noncontrolling 196 Other financing activities 197 Net cash flows from financing actvities - continuing operatii 198 Net cash flows from financing actvities 199 Cash flows from operating activities of discontinued operal 200 Cash flows from investing activities of discontinued operat 201 Cash flows from financing activities of discontinued operat 202 Cash from (used in) discontinued operations 203 Impact of exchange rates on cash, cash equivalents & restri 204 Change in cash, cash equivalents & restricted cash 205 Cash, cash equivalents & restricted cash, beginning of year 206 Cash, cash equivalents & restricted cash, end of year 207 Interest paid 208 Income taxes paid 407000 -3171000 -3171000 -26000 64000 -3737000 -3850000 -3354000 18120000 -3533000 -1587000 305000 94000 -15096000 4318000 38240000 -38881000 -2895000 318000 737000 -1430000 -871000 -1565000 435000 91000 -350000 -862000 -4385000 -4385000 1000 8000 8480000 2000 213000 9000 30000 -1951000 17954000 16003000 1892000 1638000 215000 38000 12499000 5455000 17954000 1559000 738000 -464000 622000 10978000 -626000 10974000 -98000 1300000 4155000 5455000 1142000 9259000 200