ACCOUNTING
Hello! Kindly help me on my homework which is due in an hour. These are the questions and given. Consider Year 2 and I'm just not sure if all the data on the table shall be considered for numbers 3-5, if you may, provide solution for year 2 and all years. Thanks :) A complete solution would be great! Thanks.
- Break-Even Sales Revenue
- Break-Even Sales Quantity (Based on Year 2 since Year 1 was a loss: Use Selling Price @1.785/pc & CGS @1.025/pc)
- Profit Margin Ratio (Based on Year = Gross Profit / Gross Sales Rev
- Payback Period Total Investment during Investment Period = Average annual Net Income (NIBT or EBIT) during same Investment Period
- Return on Investment (ROI) (Cumulative Net Income during period Cumulative Investment on same period) = x 100 Cumulative Investment
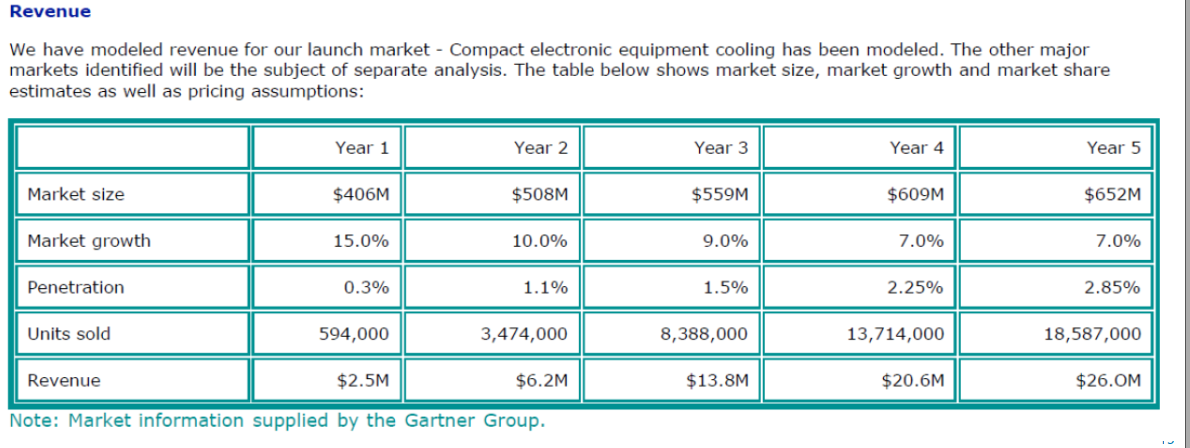
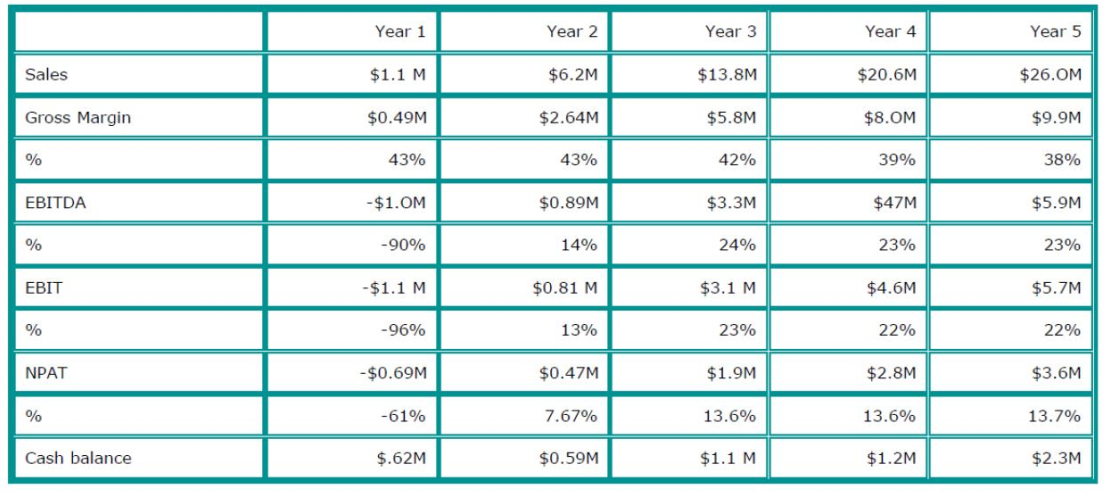
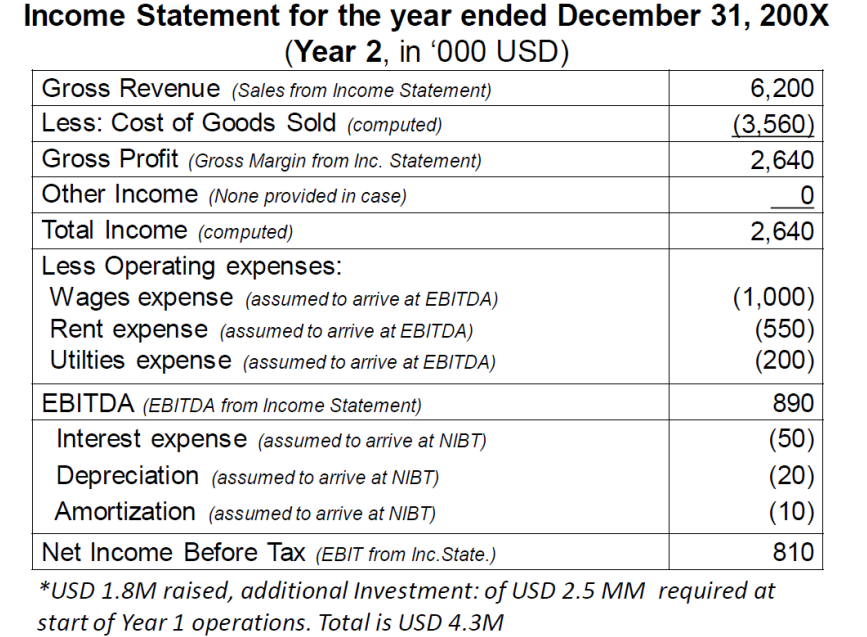
Revenue We have modeled revenue for our launch market - Compact electronic equipment cooling has been modeled. The other major markets identified will be the subject of separate analysis. The table below shows market size, market growth and market share estimates as well as pricing assumptions: Year 1 Year 2 Year 3 Year 4 Year 5 Market size $406M $508M $559M $609M $652M Market growth 15.0% 10.0% 9.0% 7.0% 7.0% Penetration 0.3% 1.1% 1.5% 2.25% 2.85% Units sold 594,000 3,474,000 8,388,000 13,714,000 18,587,000 Revenue $2.5M $6.2M $13.8M $20.6M $26.OM Note: Market information supplied by the Gartner Group. Year 1 Year 2 Year 3 Year 4 Year 5 Sales $1.1 M $6.2M $13.8M $20.6M $26.OM Gross Margin $0.49M $2.64M $5.8M $8.OM $9.9M % 43% 43% 42% 39% 38% EBITDA - $1.OM $0.89M $3.3M $47M $5.9M % -90% 14% 24% 23% 23% EBIT - $1.1 M $0.81 M $3.1 M $4.6M $5.7M % -96% 13% 23% 22% 22% NPAT - $0.69M $0.47M $1.9M $2.8M $3.6M % -61% 7.67% 13.6% 13.6% 13.7% Cash balance $.62M $0.59M $1.1 M $1.2M $2.3M Income Statement for the year ended December 31, 200X (Year 2, in 000 USD) Gross Revenue (Sales from Income Statement) 6,200 Less: Cost of Goods Sold (computed) (3,560) Gross Profit (Gross Margin from Inc. Statement) 2,640 Other Income (None provided in case) 0 Total Income (computed) 2,640 Less Operating expenses: Wages expense (assumed to arrive at EBITDA) (1,000) Rent expense (assumed to arrive at EBITDA) (550) Utilties expense (assumed to arrive at EBITDA) (200) EBITDA (EBITDA from Income Statement) 890 Interest expense (assumed to arrive at NIBT) (50) Depreciation (assumed to arrive at NIBT) (20) Amortization (assumed to arrive at NIBT) (10) Net Income Before Tax (EBIT from Inc. State.) 810 *USD 1.8M raised, additional Investment: of USD 2.5 MM required at start of Year 1 operations. Total is USD 4.3M Revenue We have modeled revenue for our launch market - Compact electronic equipment cooling has been modeled. The other major markets identified will be the subject of separate analysis. The table below shows market size, market growth and market share estimates as well as pricing assumptions: Year 1 Year 2 Year 3 Year 4 Year 5 Market size $406M $508M $559M $609M $652M Market growth 15.0% 10.0% 9.0% 7.0% 7.0% Penetration 0.3% 1.1% 1.5% 2.25% 2.85% Units sold 594,000 3,474,000 8,388,000 13,714,000 18,587,000 Revenue $2.5M $6.2M $13.8M $20.6M $26.OM Note: Market information supplied by the Gartner Group. Year 1 Year 2 Year 3 Year 4 Year 5 Sales $1.1 M $6.2M $13.8M $20.6M $26.OM Gross Margin $0.49M $2.64M $5.8M $8.OM $9.9M % 43% 43% 42% 39% 38% EBITDA - $1.OM $0.89M $3.3M $47M $5.9M % -90% 14% 24% 23% 23% EBIT - $1.1 M $0.81 M $3.1 M $4.6M $5.7M % -96% 13% 23% 22% 22% NPAT - $0.69M $0.47M $1.9M $2.8M $3.6M % -61% 7.67% 13.6% 13.6% 13.7% Cash balance $.62M $0.59M $1.1 M $1.2M $2.3M Income Statement for the year ended December 31, 200X (Year 2, in 000 USD) Gross Revenue (Sales from Income Statement) 6,200 Less: Cost of Goods Sold (computed) (3,560) Gross Profit (Gross Margin from Inc. Statement) 2,640 Other Income (None provided in case) 0 Total Income (computed) 2,640 Less Operating expenses: Wages expense (assumed to arrive at EBITDA) (1,000) Rent expense (assumed to arrive at EBITDA) (550) Utilties expense (assumed to arrive at EBITDA) (200) EBITDA (EBITDA from Income Statement) 890 Interest expense (assumed to arrive at NIBT) (50) Depreciation (assumed to arrive at NIBT) (20) Amortization (assumed to arrive at NIBT) (10) Net Income Before Tax (EBIT from Inc. State.) 810 *USD 1.8M raised, additional Investment: of USD 2.5 MM required at start of Year 1 operations. Total is USD 4.3M