Answered step by step
Verified Expert Solution
Question
1 Approved Answer
I. GRAPH 15 12 0 Show y SSR 0 2 4 6 8 10 12 14 16 x Proposed Regression Line Show residuals y-9


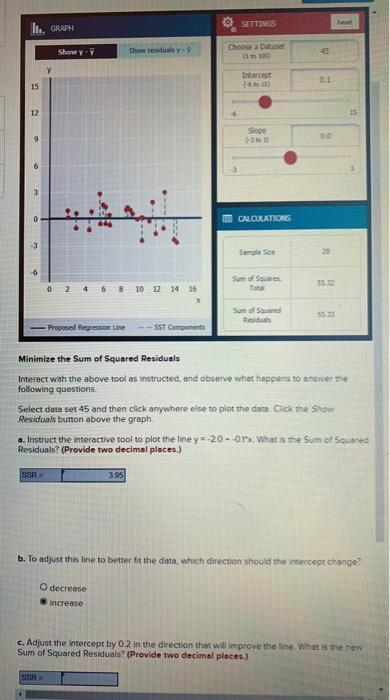
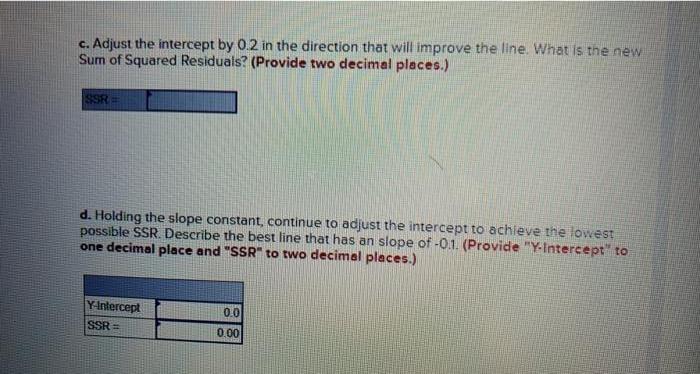
I. GRAPH 15 12 0 Show y SSR 0 2 4 6 8 10 12 14 16 x Proposed Regression Line Show residuals y-9 SSR= SST Components SETTINGS 3.95 Choose a Datanet (2 to 2000 Intercept Slope CALCULATIONS Sample Se Sum of Squares Total Sum of Squared Residuals 45 0.1 0.0 Minimize the Sum of Squared Residuals Interact with the above tool as instructed, and observe what happens to answer the following questions 29 Select data set 45 and then click anywhere else to plot the data. Click the Show Residuals button above the graph. 55.32 a. Instruct the interactive tool to plot the line y=-2.0--01x What is the Sum of Squared Residuals? (Provide two decimal places.) b. To adjust this line to better fit the data, which direction should the intercept change? O decrease increase c. Adjust the intercept by 0.2 in the direction that will improve the line. What is the new Sum of Squared Residuals? (Provide two decimal places) c. Adjust the intercept by 0.2 in the direction that will improve the line. What is the new Sum of Squared Residuals? (Provide two decimal places.) SSR= d. Holding the slope constant, continue to adjust the intercept to achieve the lowest possible SSR. Describe the best line that has an slope of -0.1. (Provide "Y-Intercept" to one decimal place and "SSR" to two decimal places.) Y-Intercept SSR= 0.0 0.00
Step by Step Solution
★★★★★
3.45 Rating (161 Votes )
There are 3 Steps involved in it
Step: 1
Changing the speed of time keeping is accomplished by moving the pendulum disk up or dow...
Get Instant Access to Expert-Tailored Solutions
See step-by-step solutions with expert insights and AI powered tools for academic success
Step: 2

Step: 3

Ace Your Homework with AI
Get the answers you need in no time with our AI-driven, step-by-step assistance
Get Started


