Question
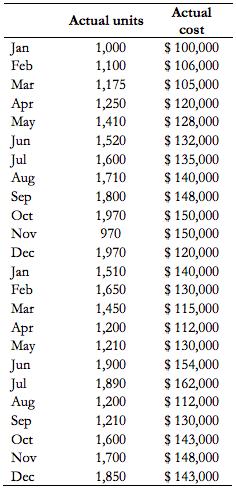
Using the data in Exhibit 2 calculate the cost function (y=mx + b) using the high-low method a. Be sure to check for outliers in
Using the data in Exhibit 2 calculate the cost function (y=mx + b) using the high-low method a. Be sure to check for outliers in the data prior to choosing your high-low points.
Actual Actual units cost $ 100,000 $ 106,000 $ 105,000 $ 120,000 $ 128,000 $ 132,000 $ 135,000 $ 140,000 $ 148,000 $ 150,000 $ 150,000 $ 120,000 $ 140,000 $ 130,000 $ 115,000 $ 112,000 $ 130,000 $ 154,000 $ 162,000 $ 112,000 $ 130,000 $ 143,000 $ 148,000 $ 143,000 Jan 1,000 1,100 Feb Mar 1,175 Apr May 1,250 1,410 1,520 Jun Jul Aug Sep 1,600 1,710 1,800 Oct 1,970 Nov 970 Dec 1,970 Jan Feb 1,510 1,650 Mar 1,450 Apr ay Jun Jul Aug Sep 1,200 1,210 1,900 1,890 1,200 1,210 Oct 1,600 1,700 Nov Dec 1,850
Step by Step Solution
3.46 Rating (153 Votes )
There are 3 Steps involved in it
Step: 1
Highlow method is a way of attempting to separate out fixed and variable costs given a limited amoun...
Get Instant Access to Expert-Tailored Solutions
See step-by-step solutions with expert insights and AI powered tools for academic success
Step: 2

Step: 3

Ace Your Homework with AI
Get the answers you need in no time with our AI-driven, step-by-step assistance
Get StartedRecommended Textbook for
Financial Reporting Financial Statement Analysis And Valuation A Strategic Perspective
Authors: James M. Wahlen, Stephen P. Baginski, Mark Bradshaw
9th Edition
1337614689, 1337614688, 9781337668262, 978-1337614689
Students also viewed these Accounting questions
Question
Answered: 1 week ago
Question
Answered: 1 week ago
Question
Answered: 1 week ago
Question
Answered: 1 week ago
Question
Answered: 1 week ago
Question
Answered: 1 week ago
Question
Answered: 1 week ago
Question
Answered: 1 week ago
Question
Answered: 1 week ago
Question
Answered: 1 week ago
Question
Answered: 1 week ago
Question
Answered: 1 week ago
Question
Answered: 1 week ago
Question
Answered: 1 week ago
Question
Answered: 1 week ago
Question
Answered: 1 week ago
Question
Answered: 1 week ago
Question
Answered: 1 week ago
Question
Answered: 1 week ago
Question
Answered: 1 week ago
Question
Answered: 1 week ago
Question
Answered: 1 week ago
View Answer in SolutionInn App


