Answered step by step
Verified Expert Solution
Question
1 Approved Answer
Read the excel file Sales.xlsx. This data shows the sales of Beikta Kooperatifi in June. Each row shows Type Product Producer Unit Price KDV

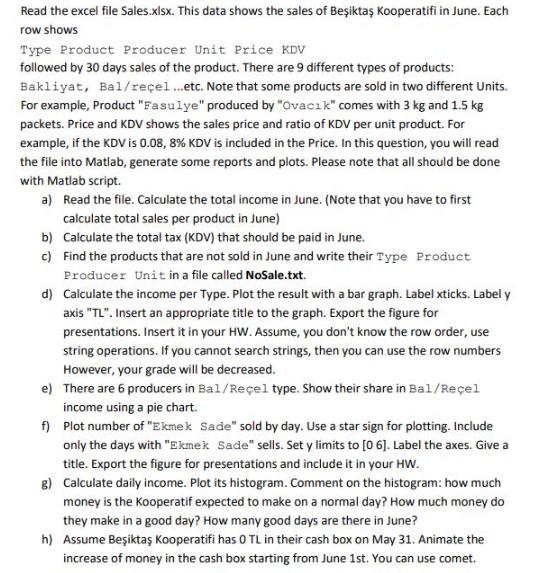
Read the excel file Sales.xlsx. This data shows the sales of Beikta Kooperatifi in June. Each row shows Type Product Producer Unit Price KDV followed by 30 days sales of the product. There are 9 different types of products: Bakliyat, Bal/reel...etc. Note that some products are sold in two different Units. For example, Product "Fasulye" produced by "Ovacik" comes with 3 kg and 1.5 kg packets. Price and KDV shows the sales price and ratio of KDV per unit product. For example, if the KDV is 0.08, 8% KDV is included in the Price. In this question, you will read the file into Matlab, generate some reports and plots. Please note that all should be done with Matlab script. a) Read the file. Calculate the total income in June. (Note that you have to first calculate total sales per product in June) b) Calculate the total tax (KDV) that should be paid in June. c) Find the products that are not sold in June and write their Type Product Producer Unit in a file called NoSale.txt. d) Calculate the income per Type. Plot the result with a bar graph. Label xticks. Label y axis "TL". Insert an appropriate title to the graph. Export the figure for presentations. Insert it in your HW. Assume, you don't know the row order, use string operations. If you cannot search strings, then you can use the row numbers However, your grade will be decreased. e) There are 6 producers in Bal/Reel type. Show their share in Bal/Reel income using a pie chart. f) Plot number of "Ekmek Sade" sold by day. Use a star sign for plotting. Include only the days with "Ekmek Sade" sells. Set y limits to [06]. Label the axes. Give a title. Export the figure for presentations and include it in your HW. g) Calculate daily income. Plot its histogram. Comment on the histogram: how much money is the Kooperatif expected to make on a normal day? How much money do they make in a good day? How many good days are there in June? h) Assume Beikta Kooperatifi has 0 TL in their cash box on May 31. Animate the increase of money in the cash box starting from June 1st. You can use comet.
Step by Step Solution
★★★★★
3.36 Rating (152 Votes )
There are 3 Steps involved in it
Step: 1
Lets create these example plots with fabricated data A bar graph for sales per product t...
Get Instant Access to Expert-Tailored Solutions
See step-by-step solutions with expert insights and AI powered tools for academic success
Step: 2

Step: 3

Ace Your Homework with AI
Get the answers you need in no time with our AI-driven, step-by-step assistance
Get Started


